Titan Tests
March 21, 2016
Below are some representative plots from the \(n_h = 1\) sphere wind simulation.
There is also a movie of the first 700 kyr of evolution at brown.as.arizona.edu/~evan/temp/swn1.mov
Snapshots:


Density-temperature plots:
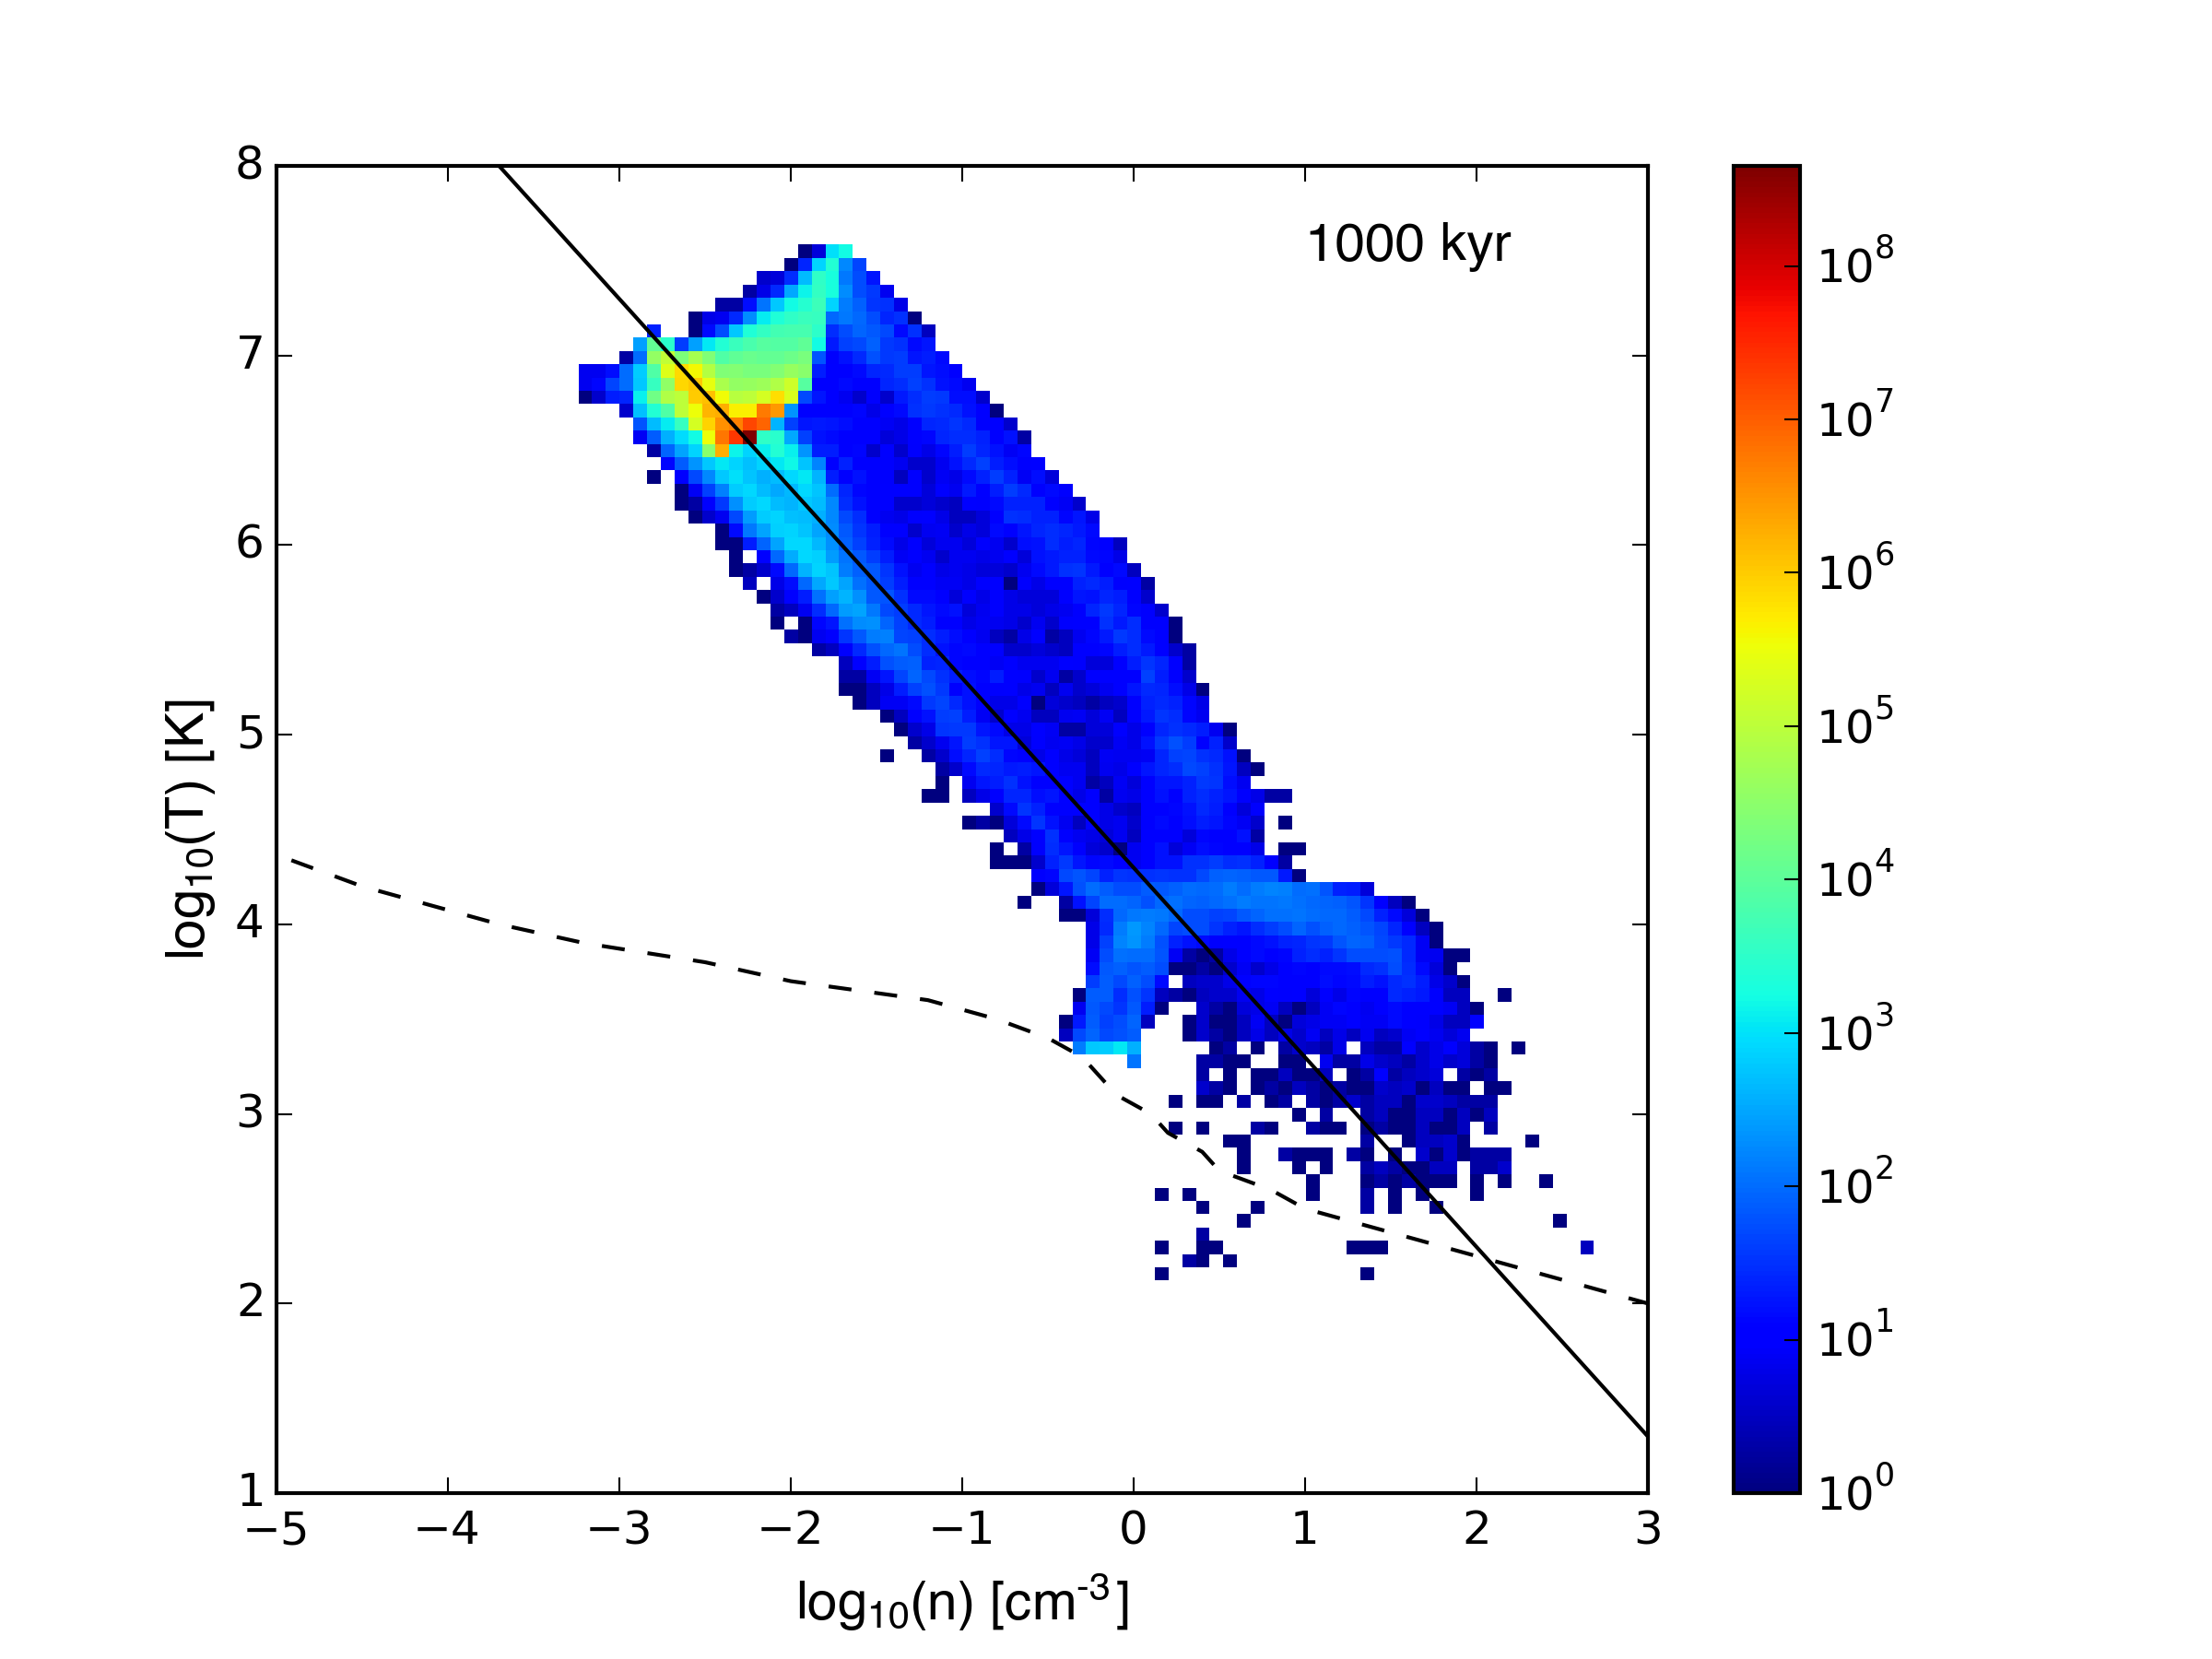
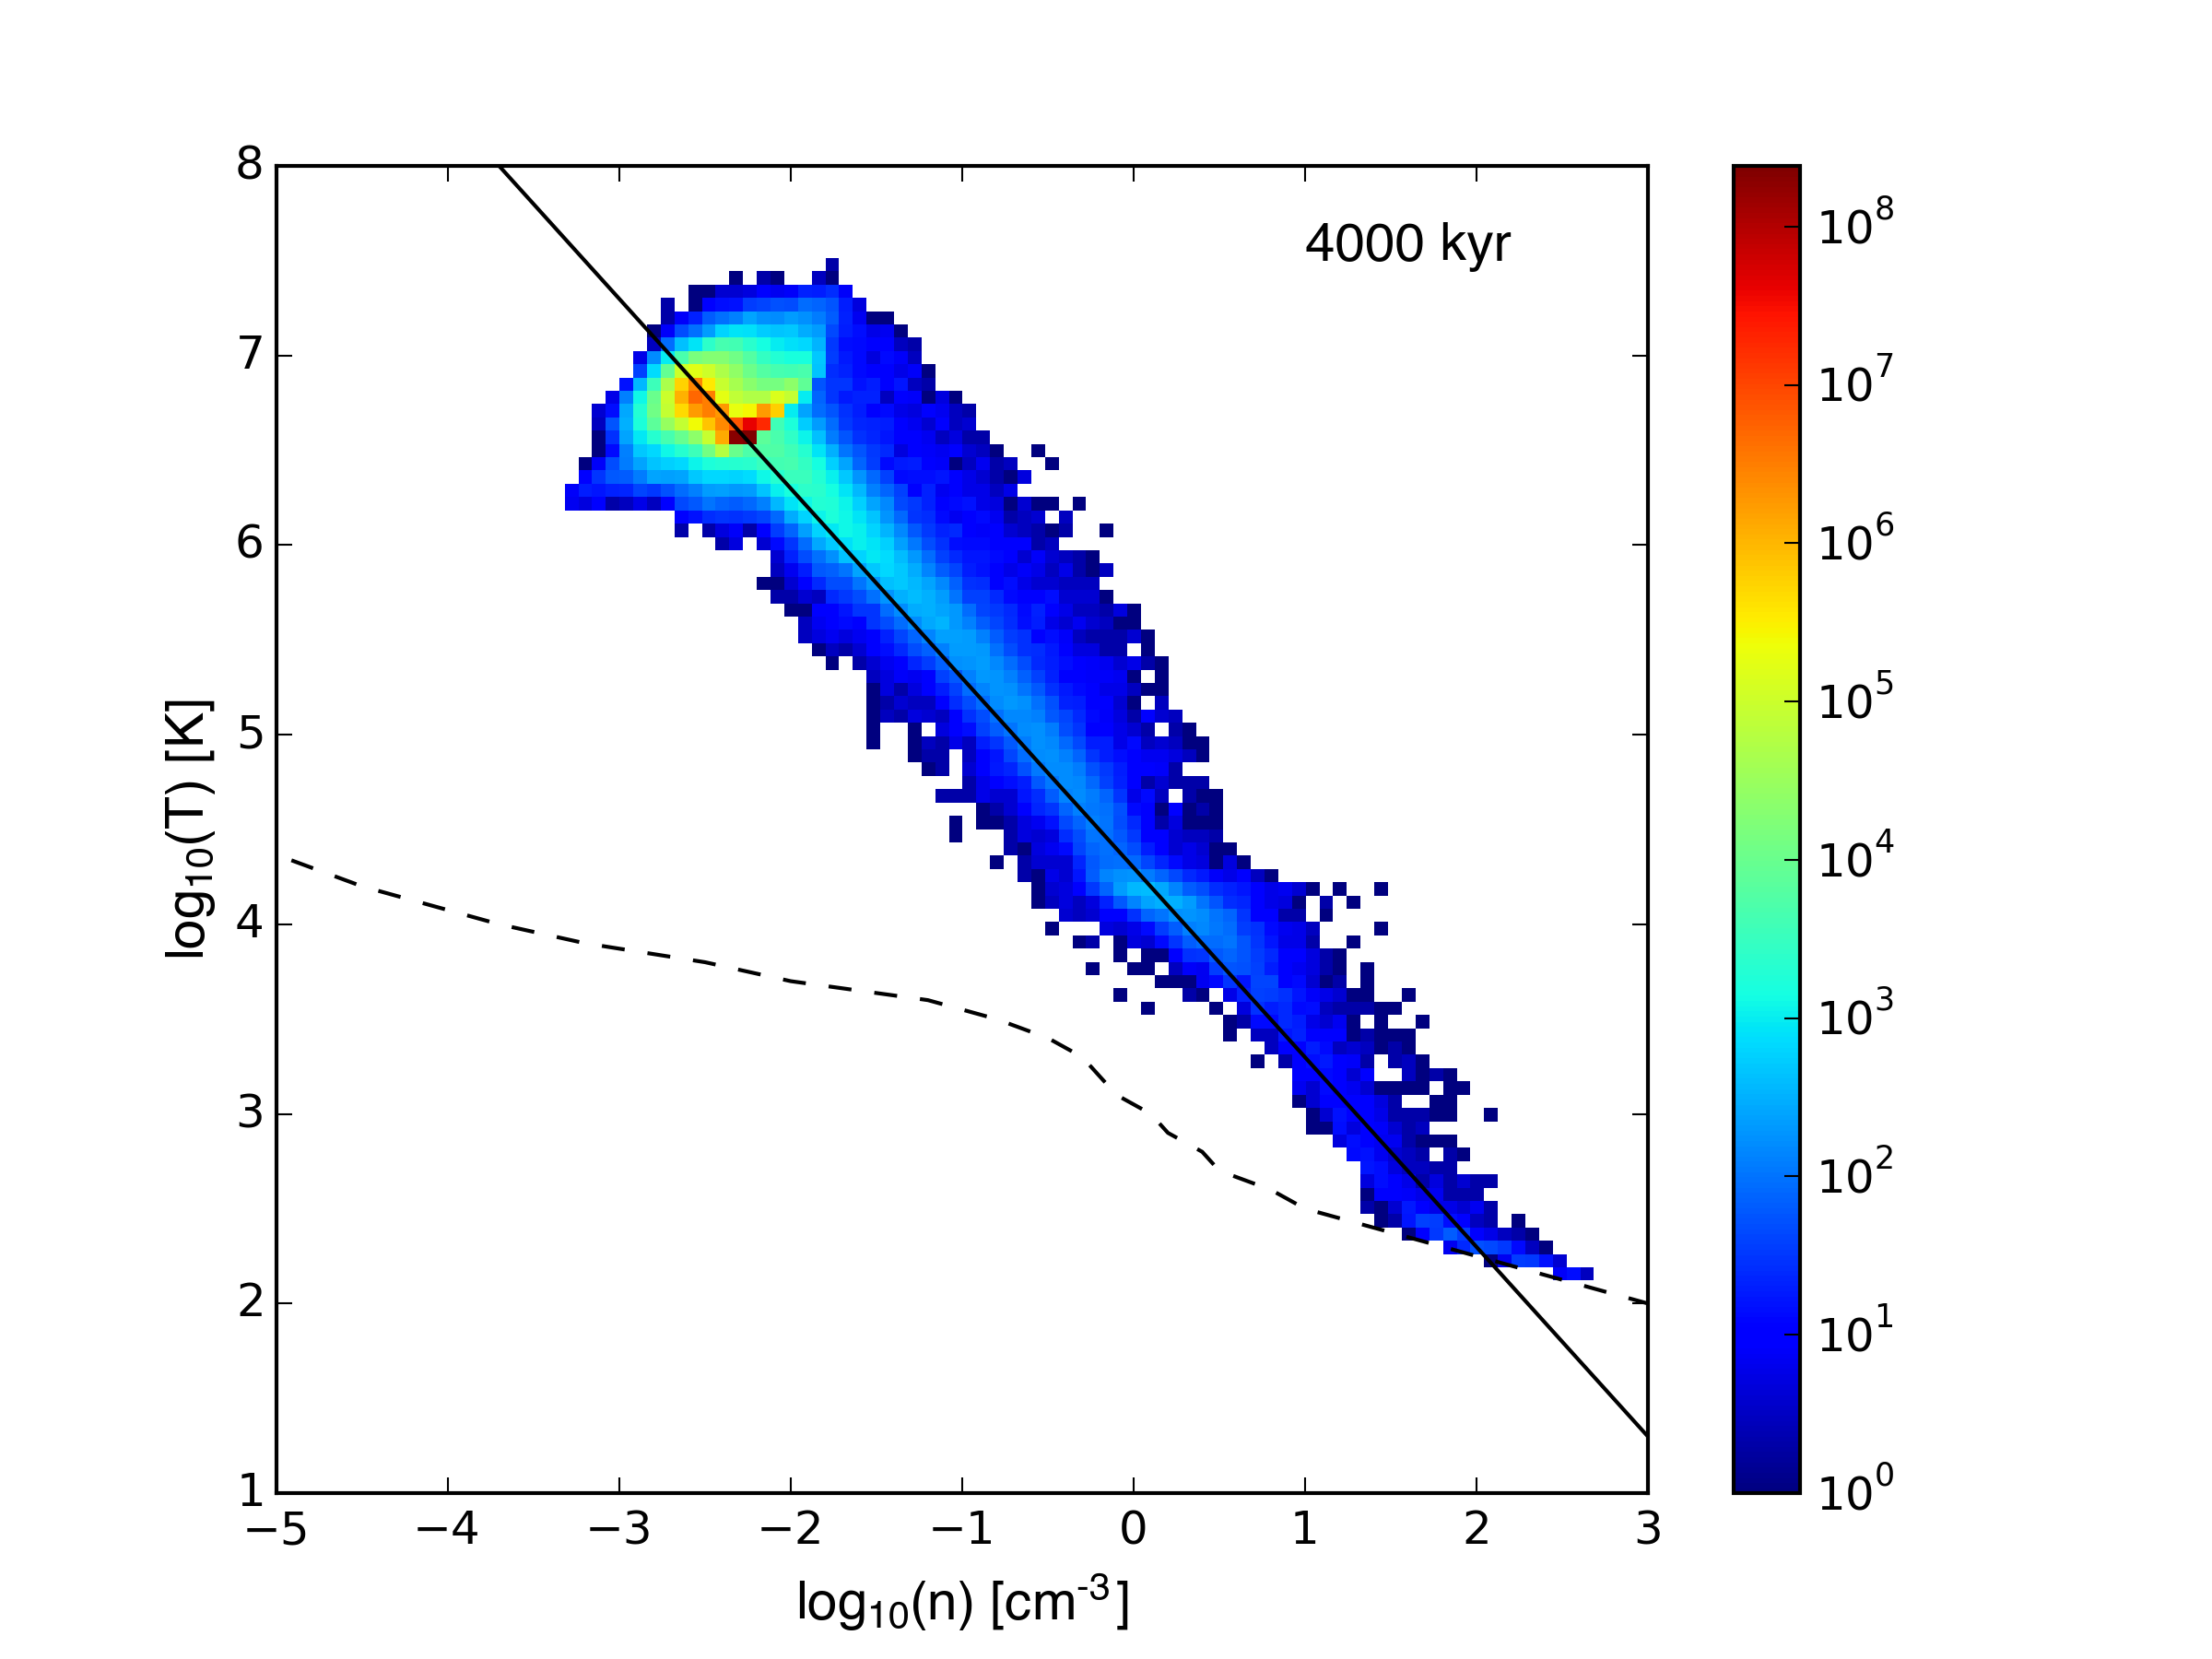
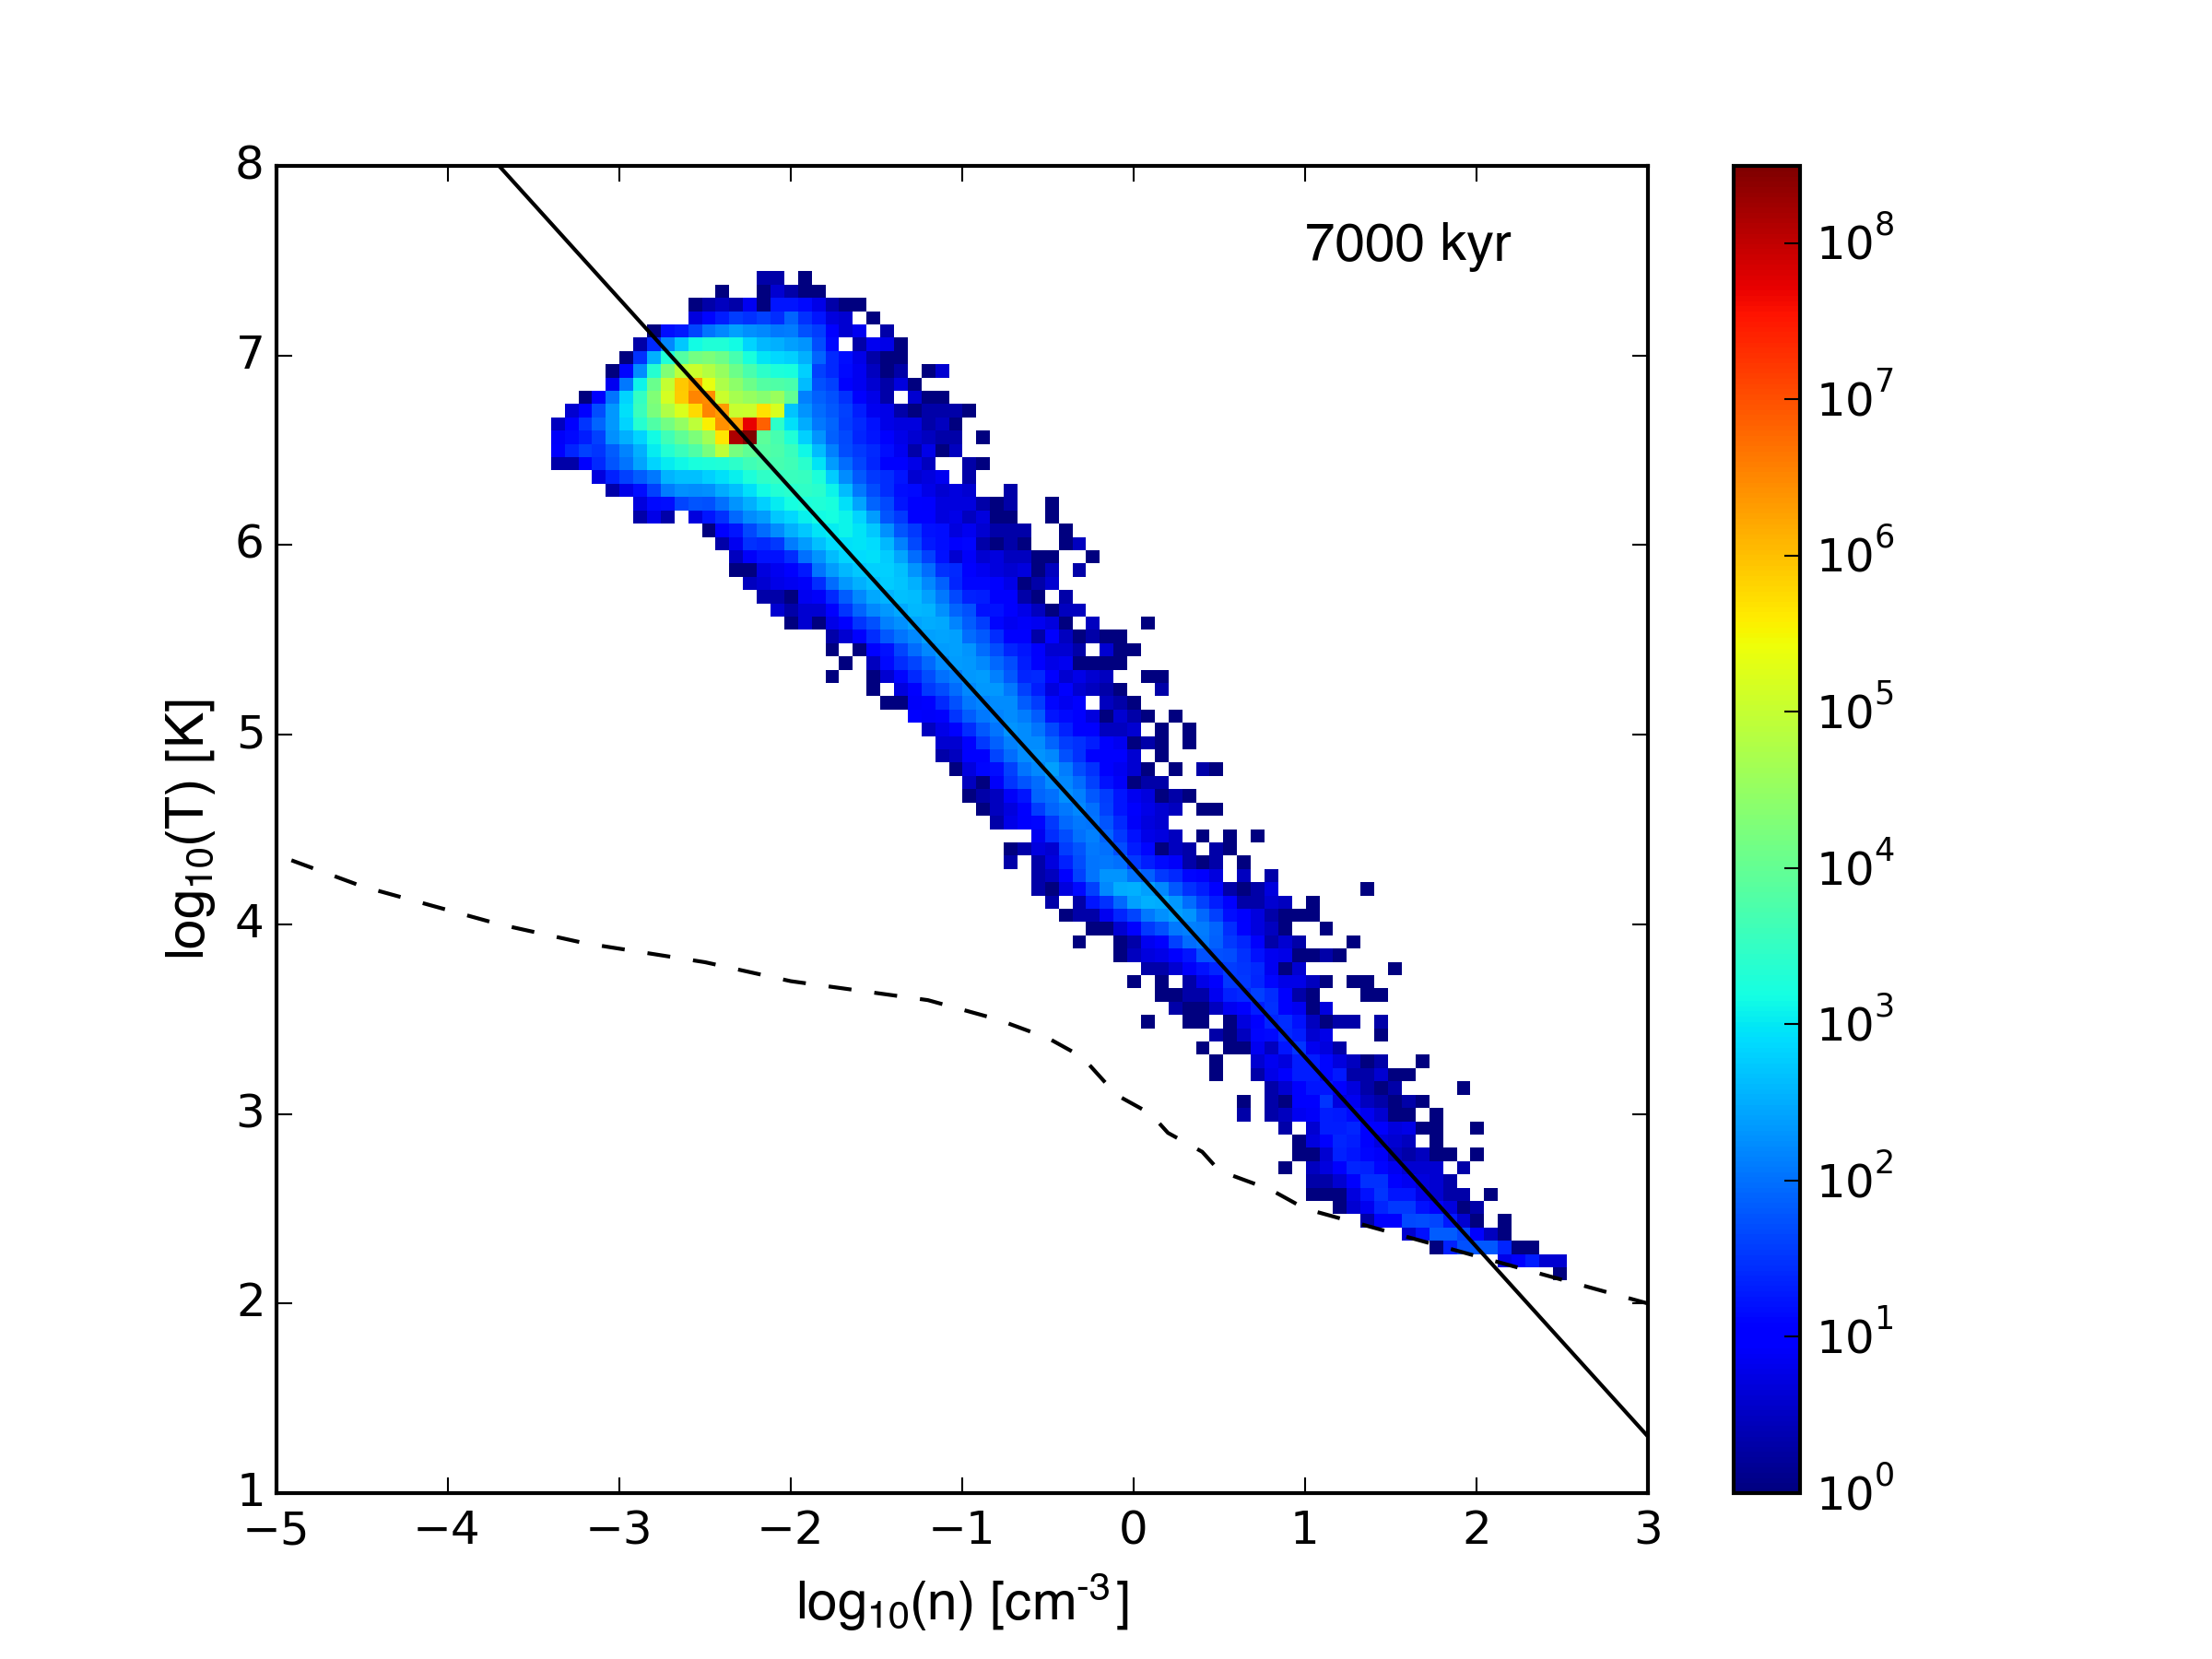
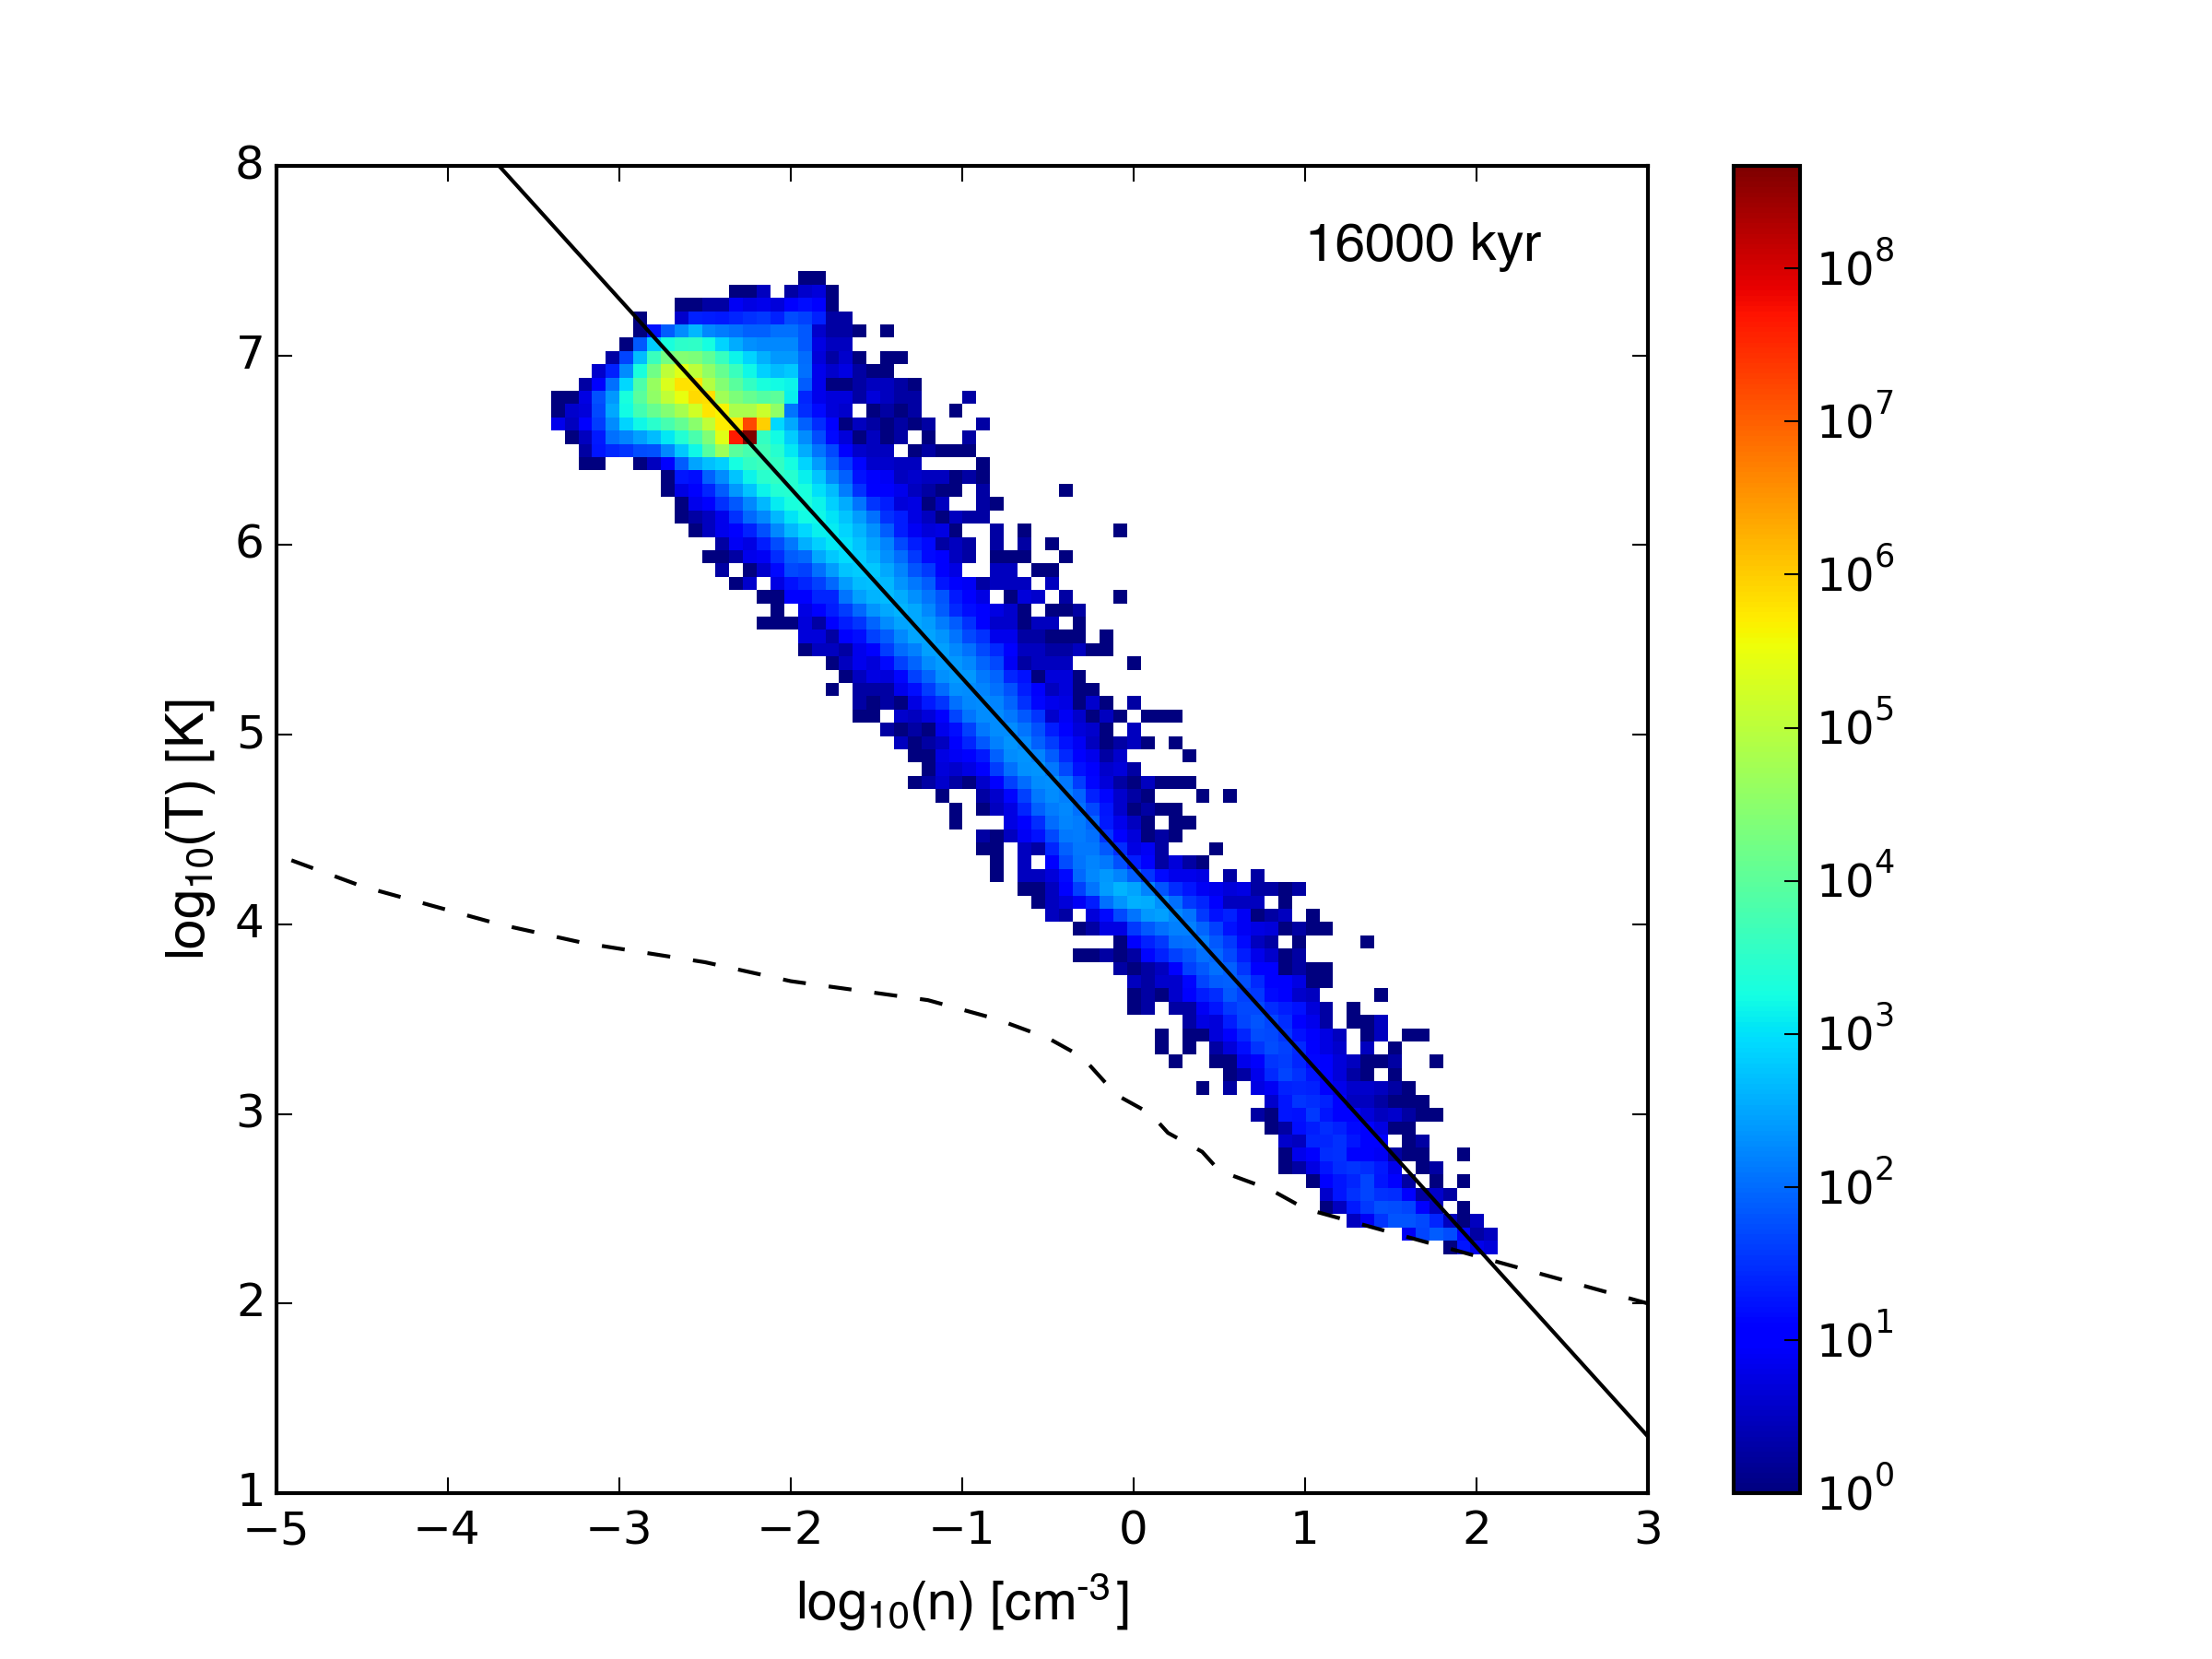
Velocity-weighted density-temperature plots:
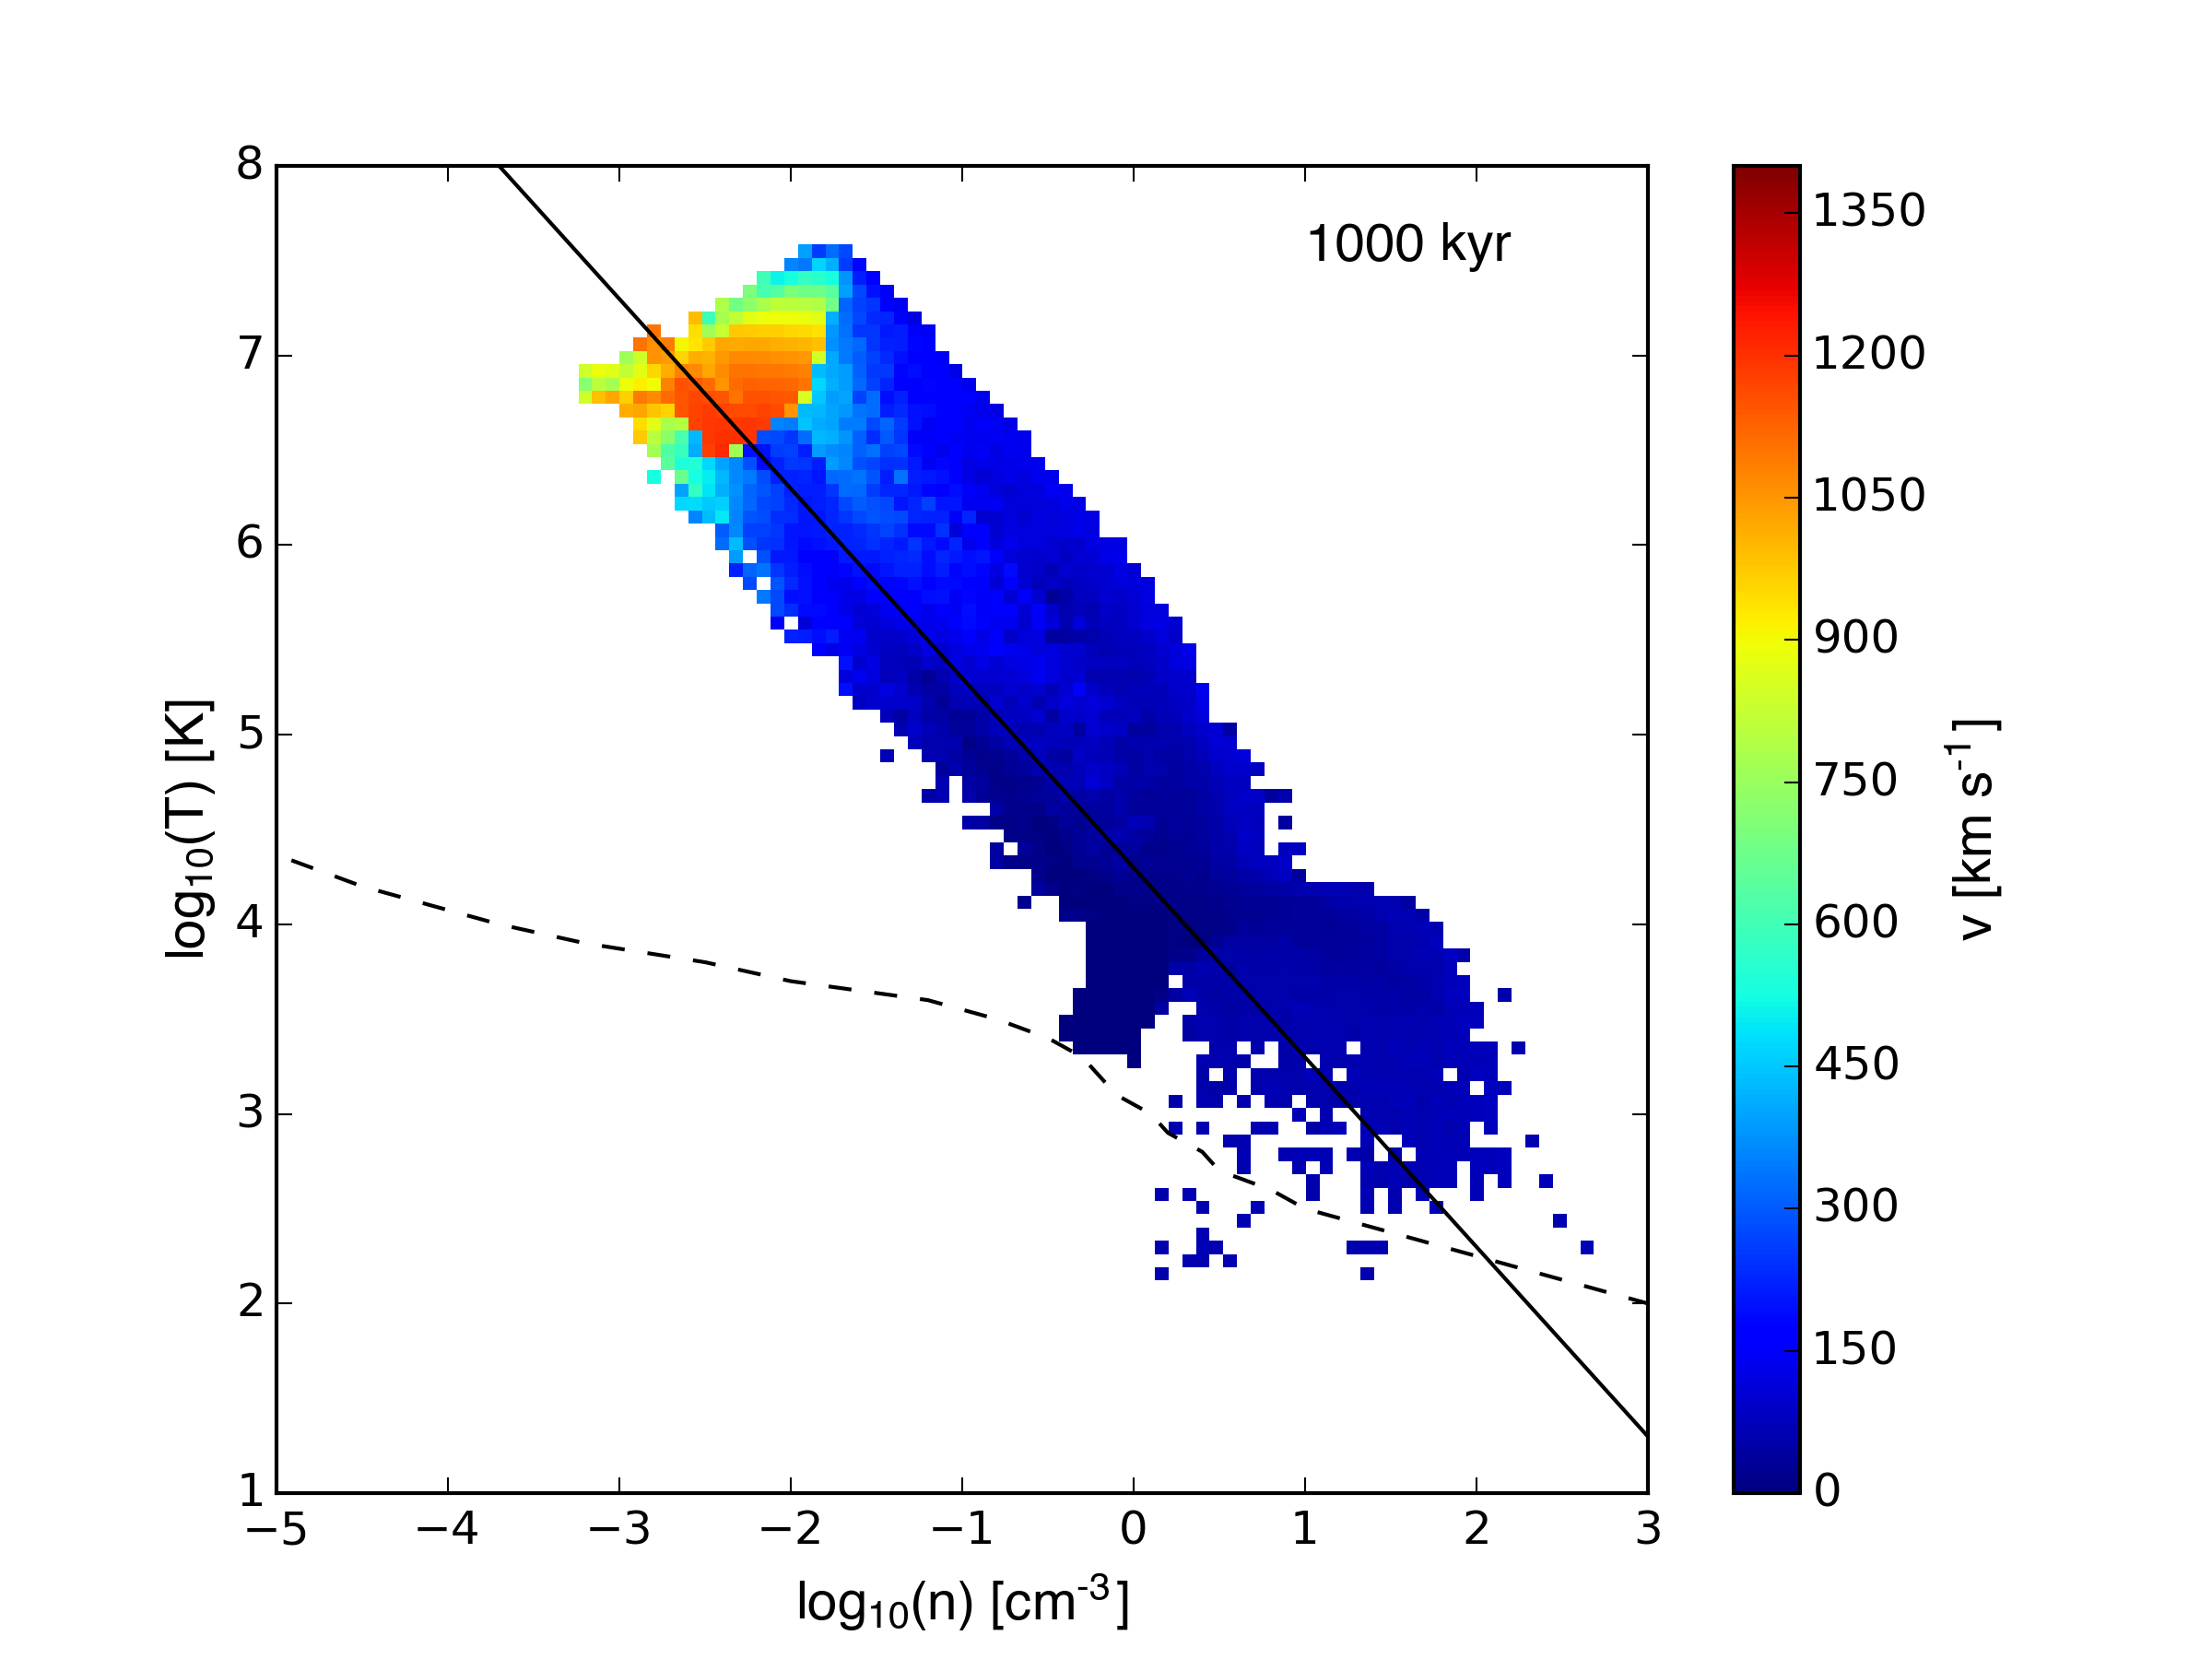
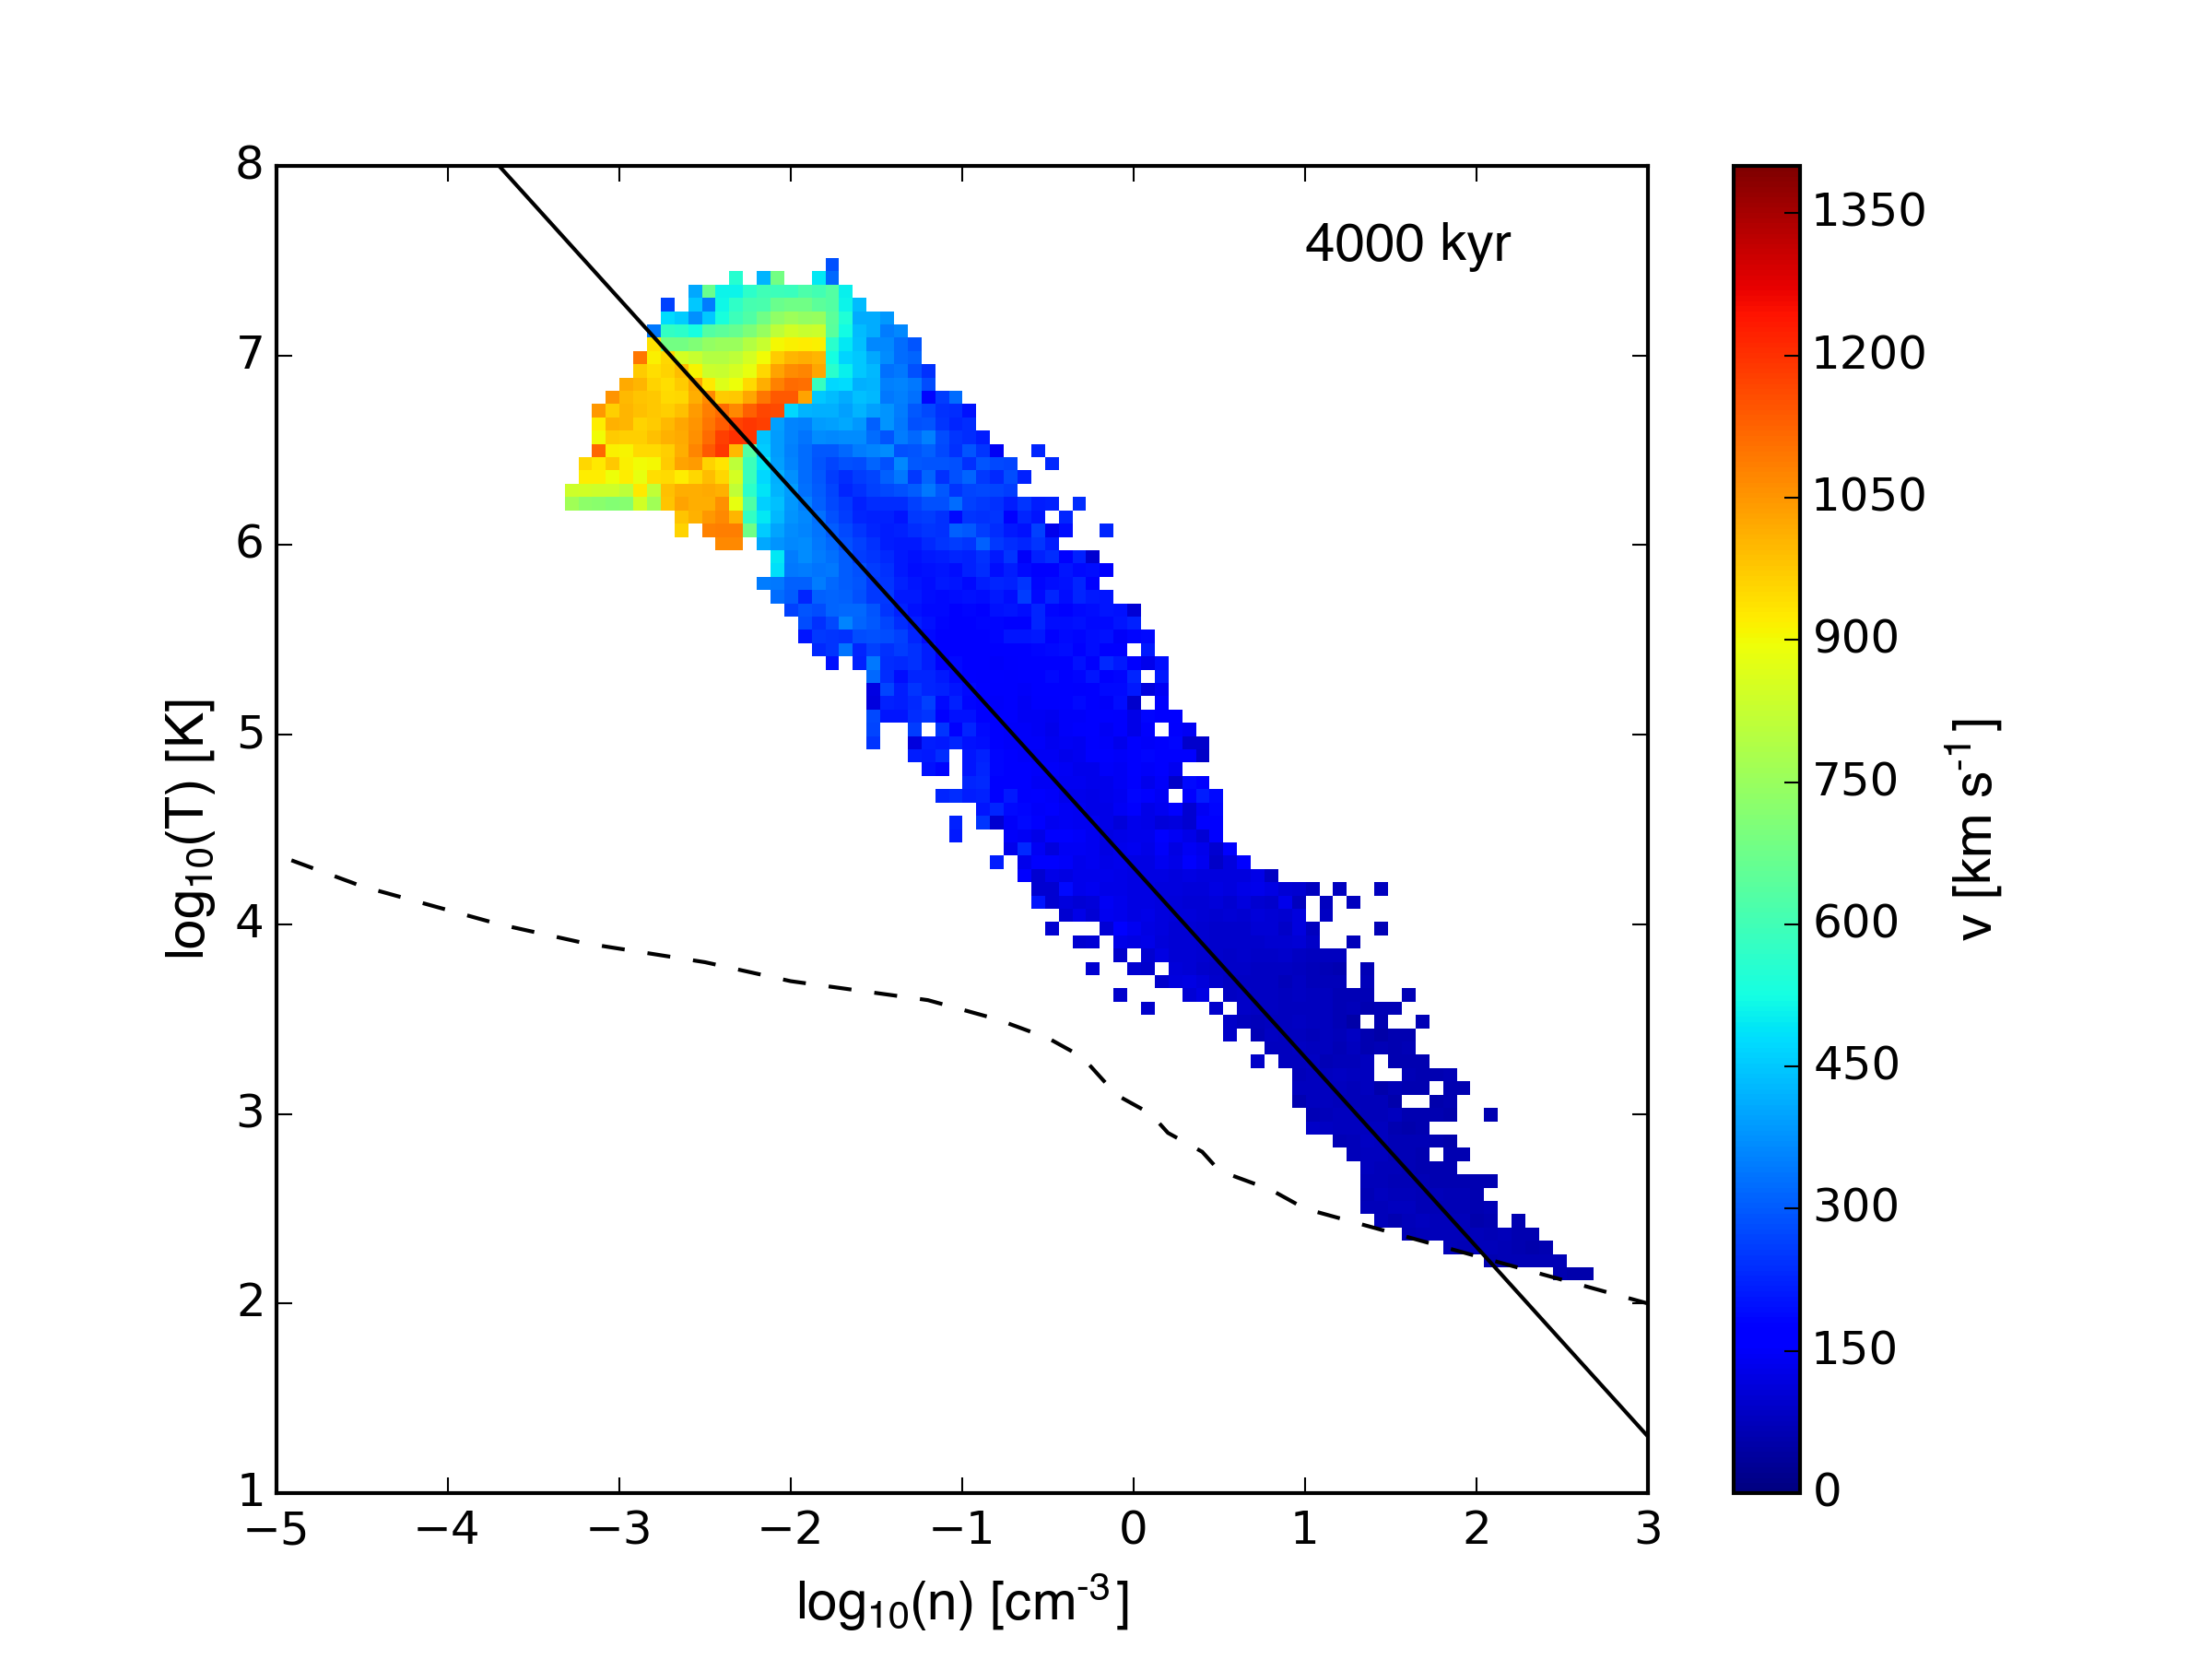
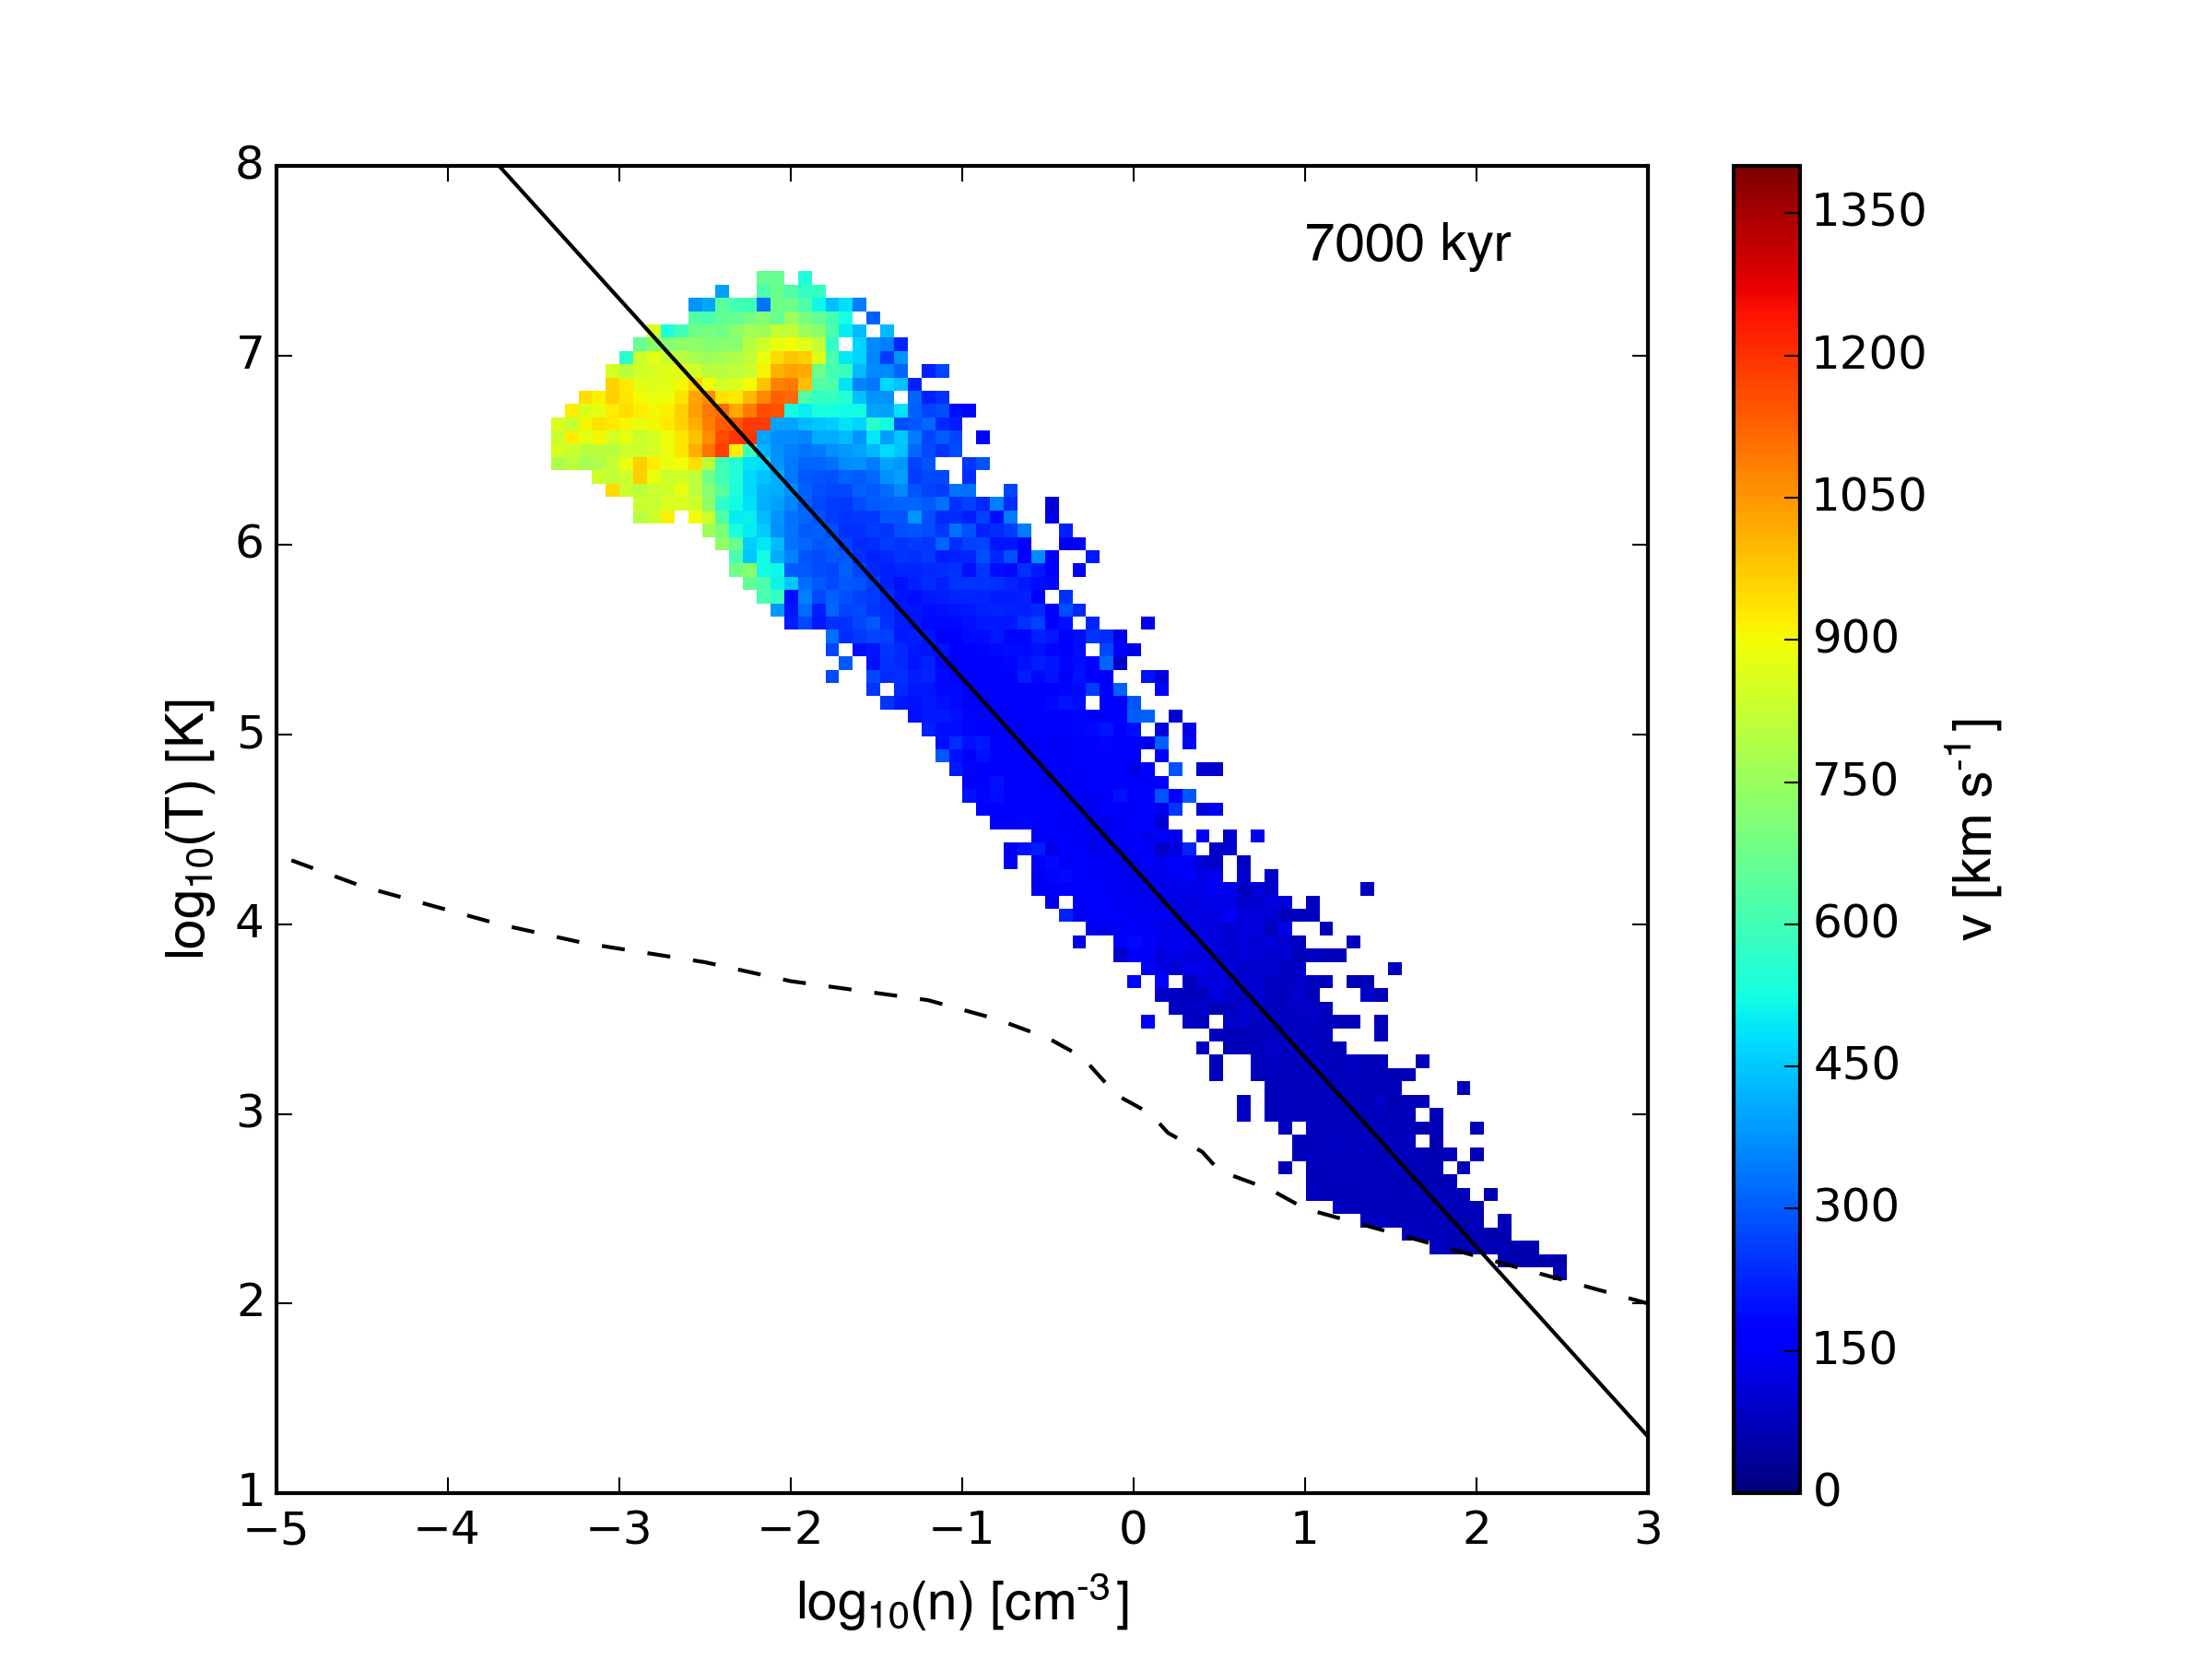
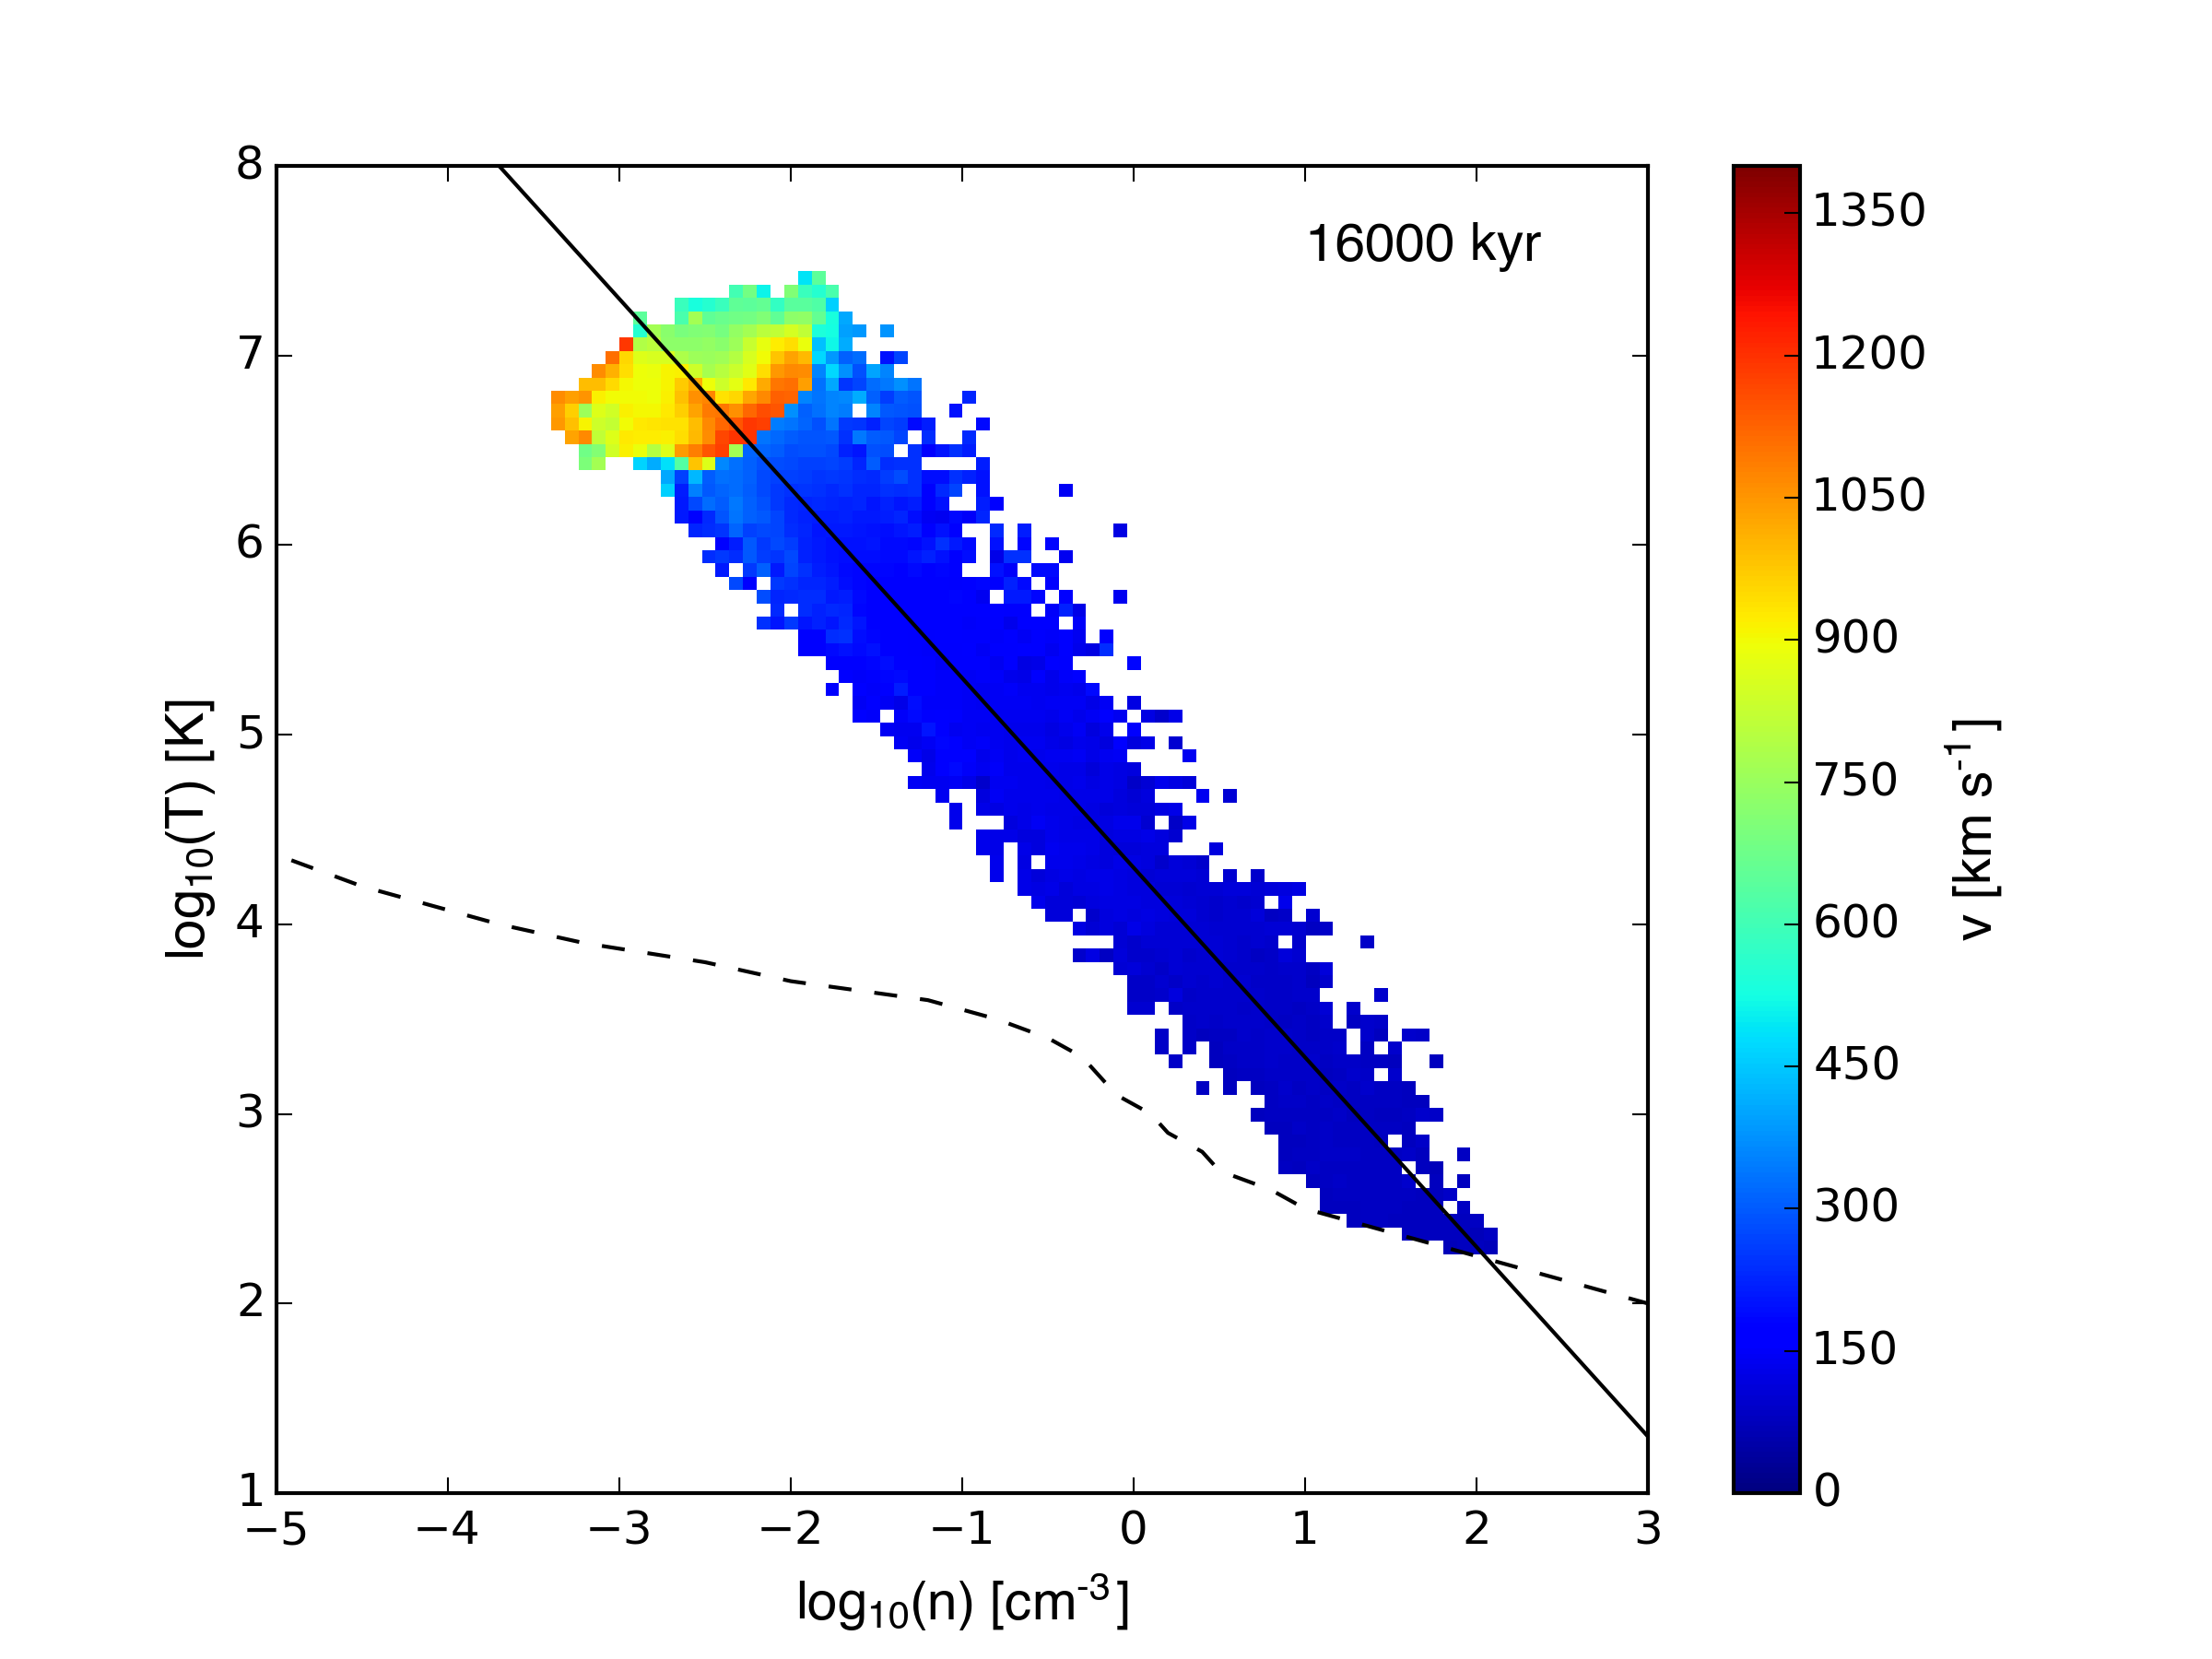
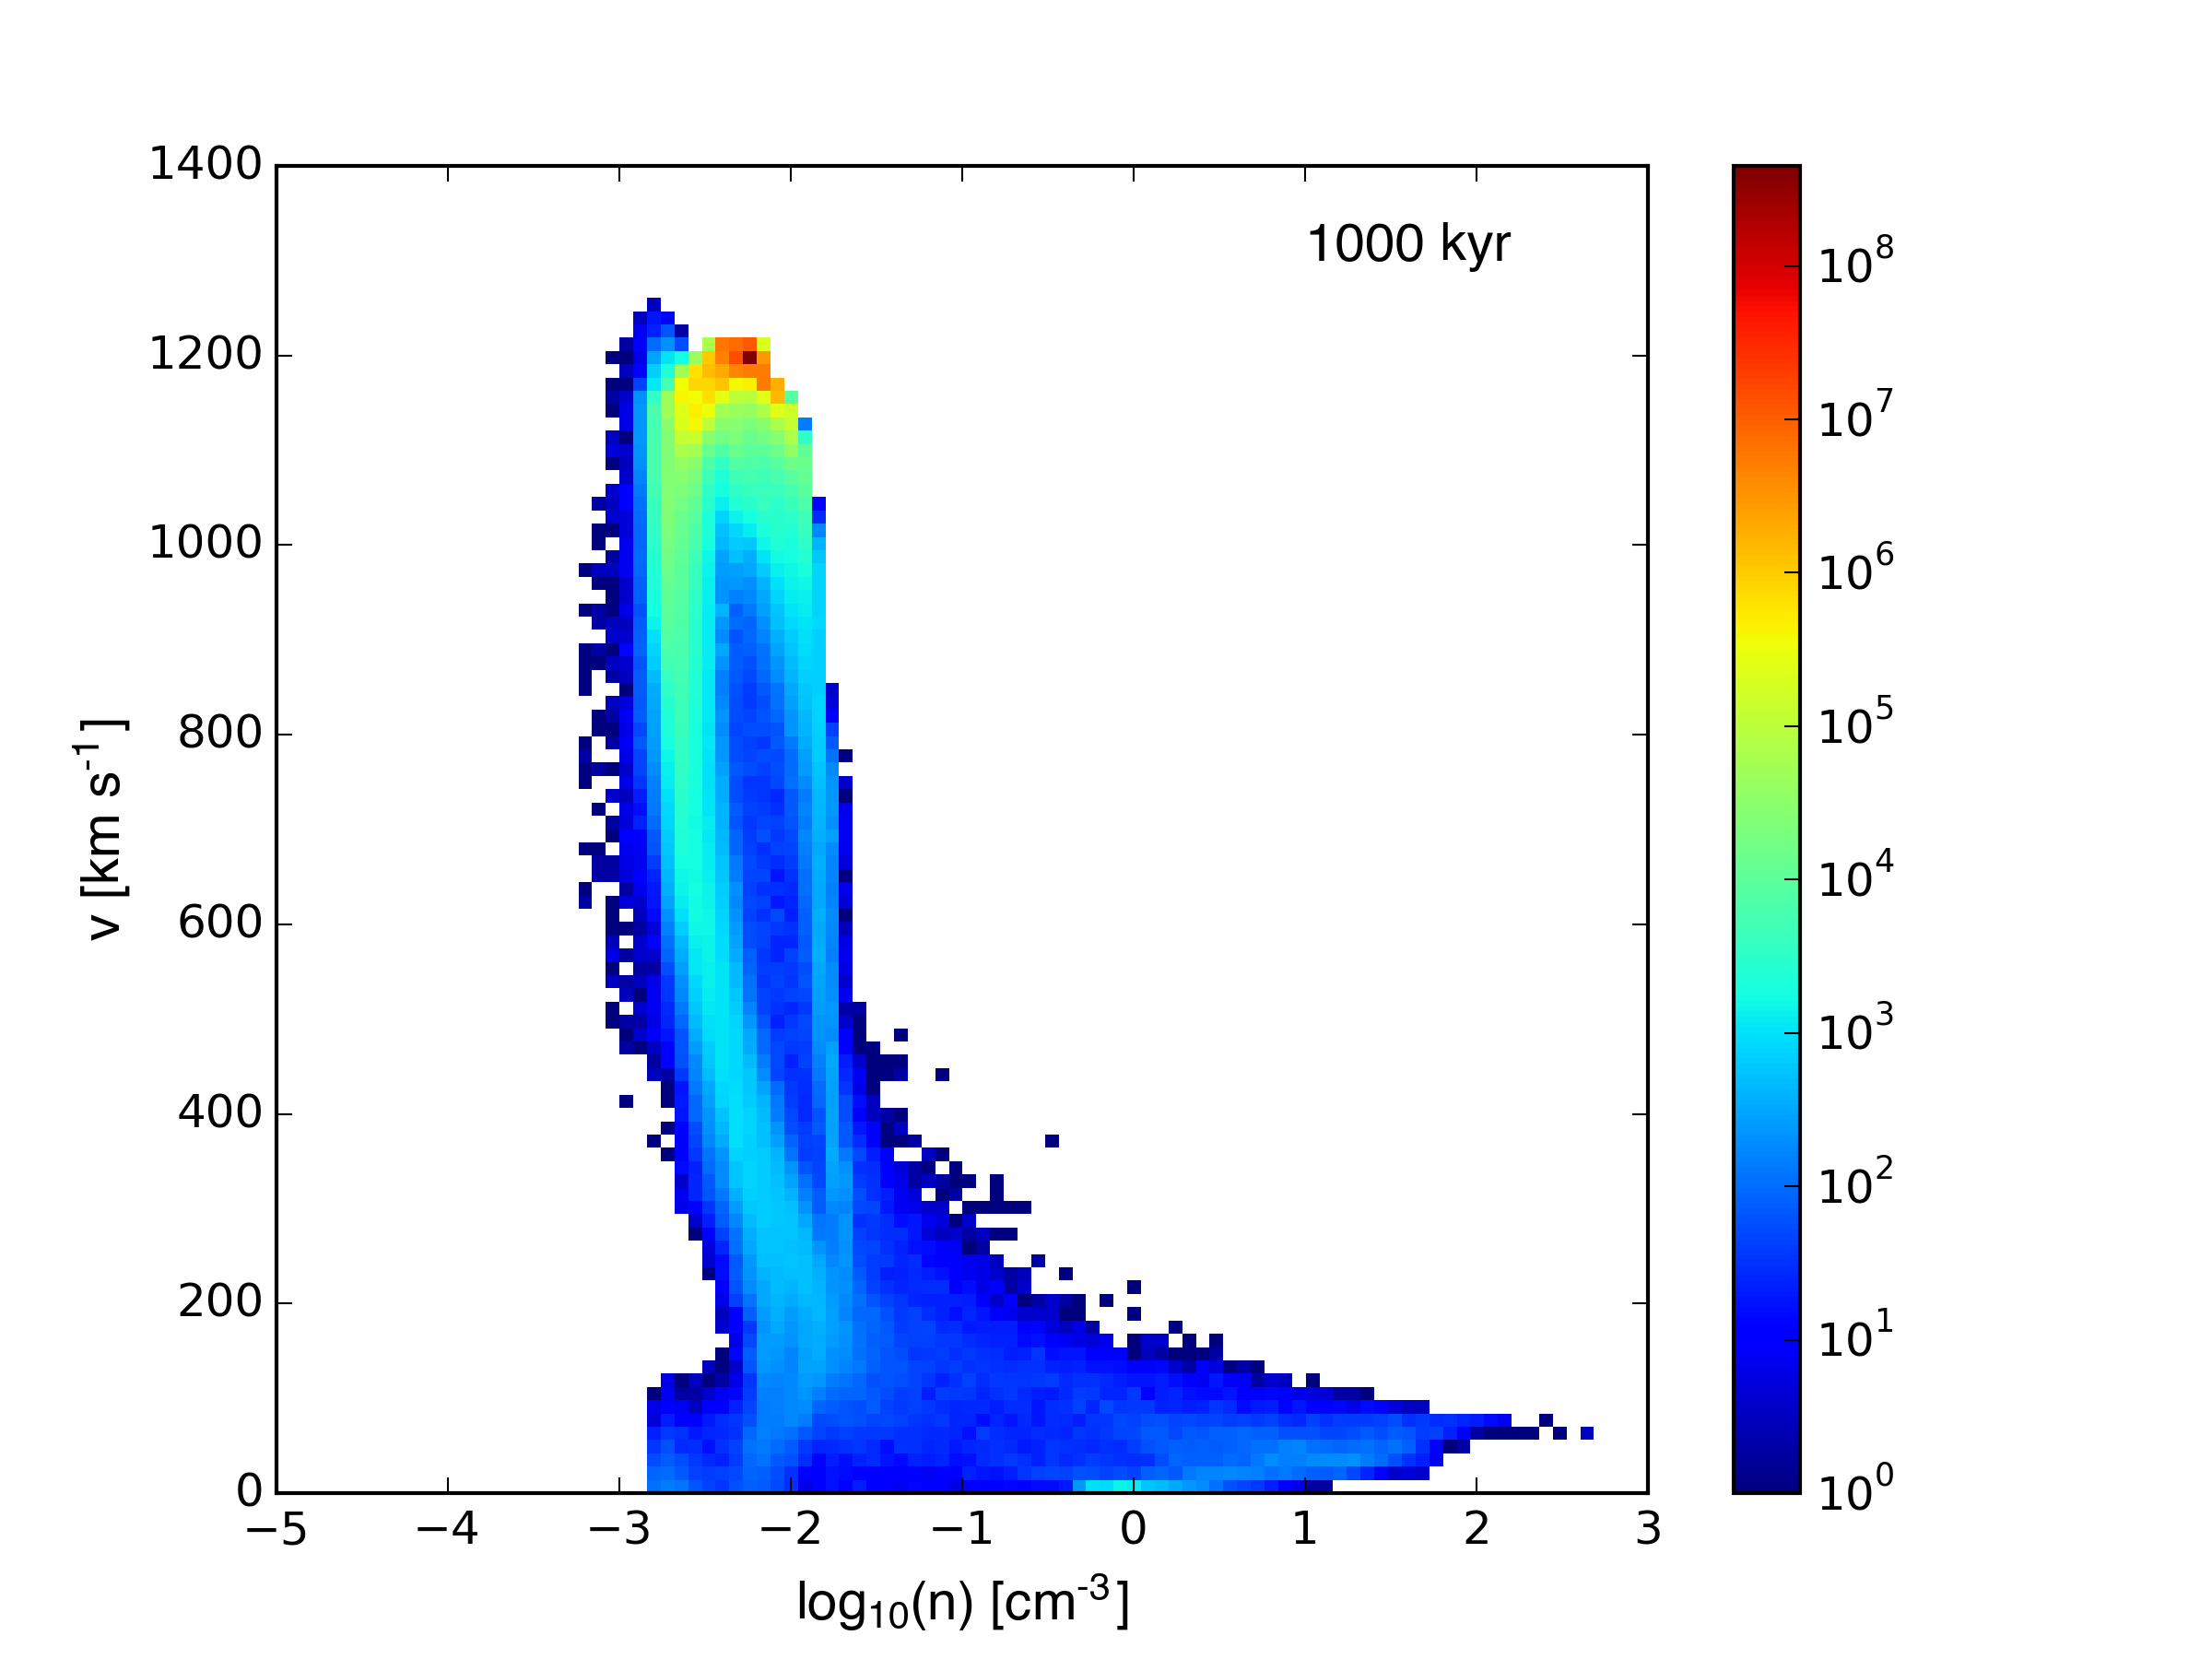
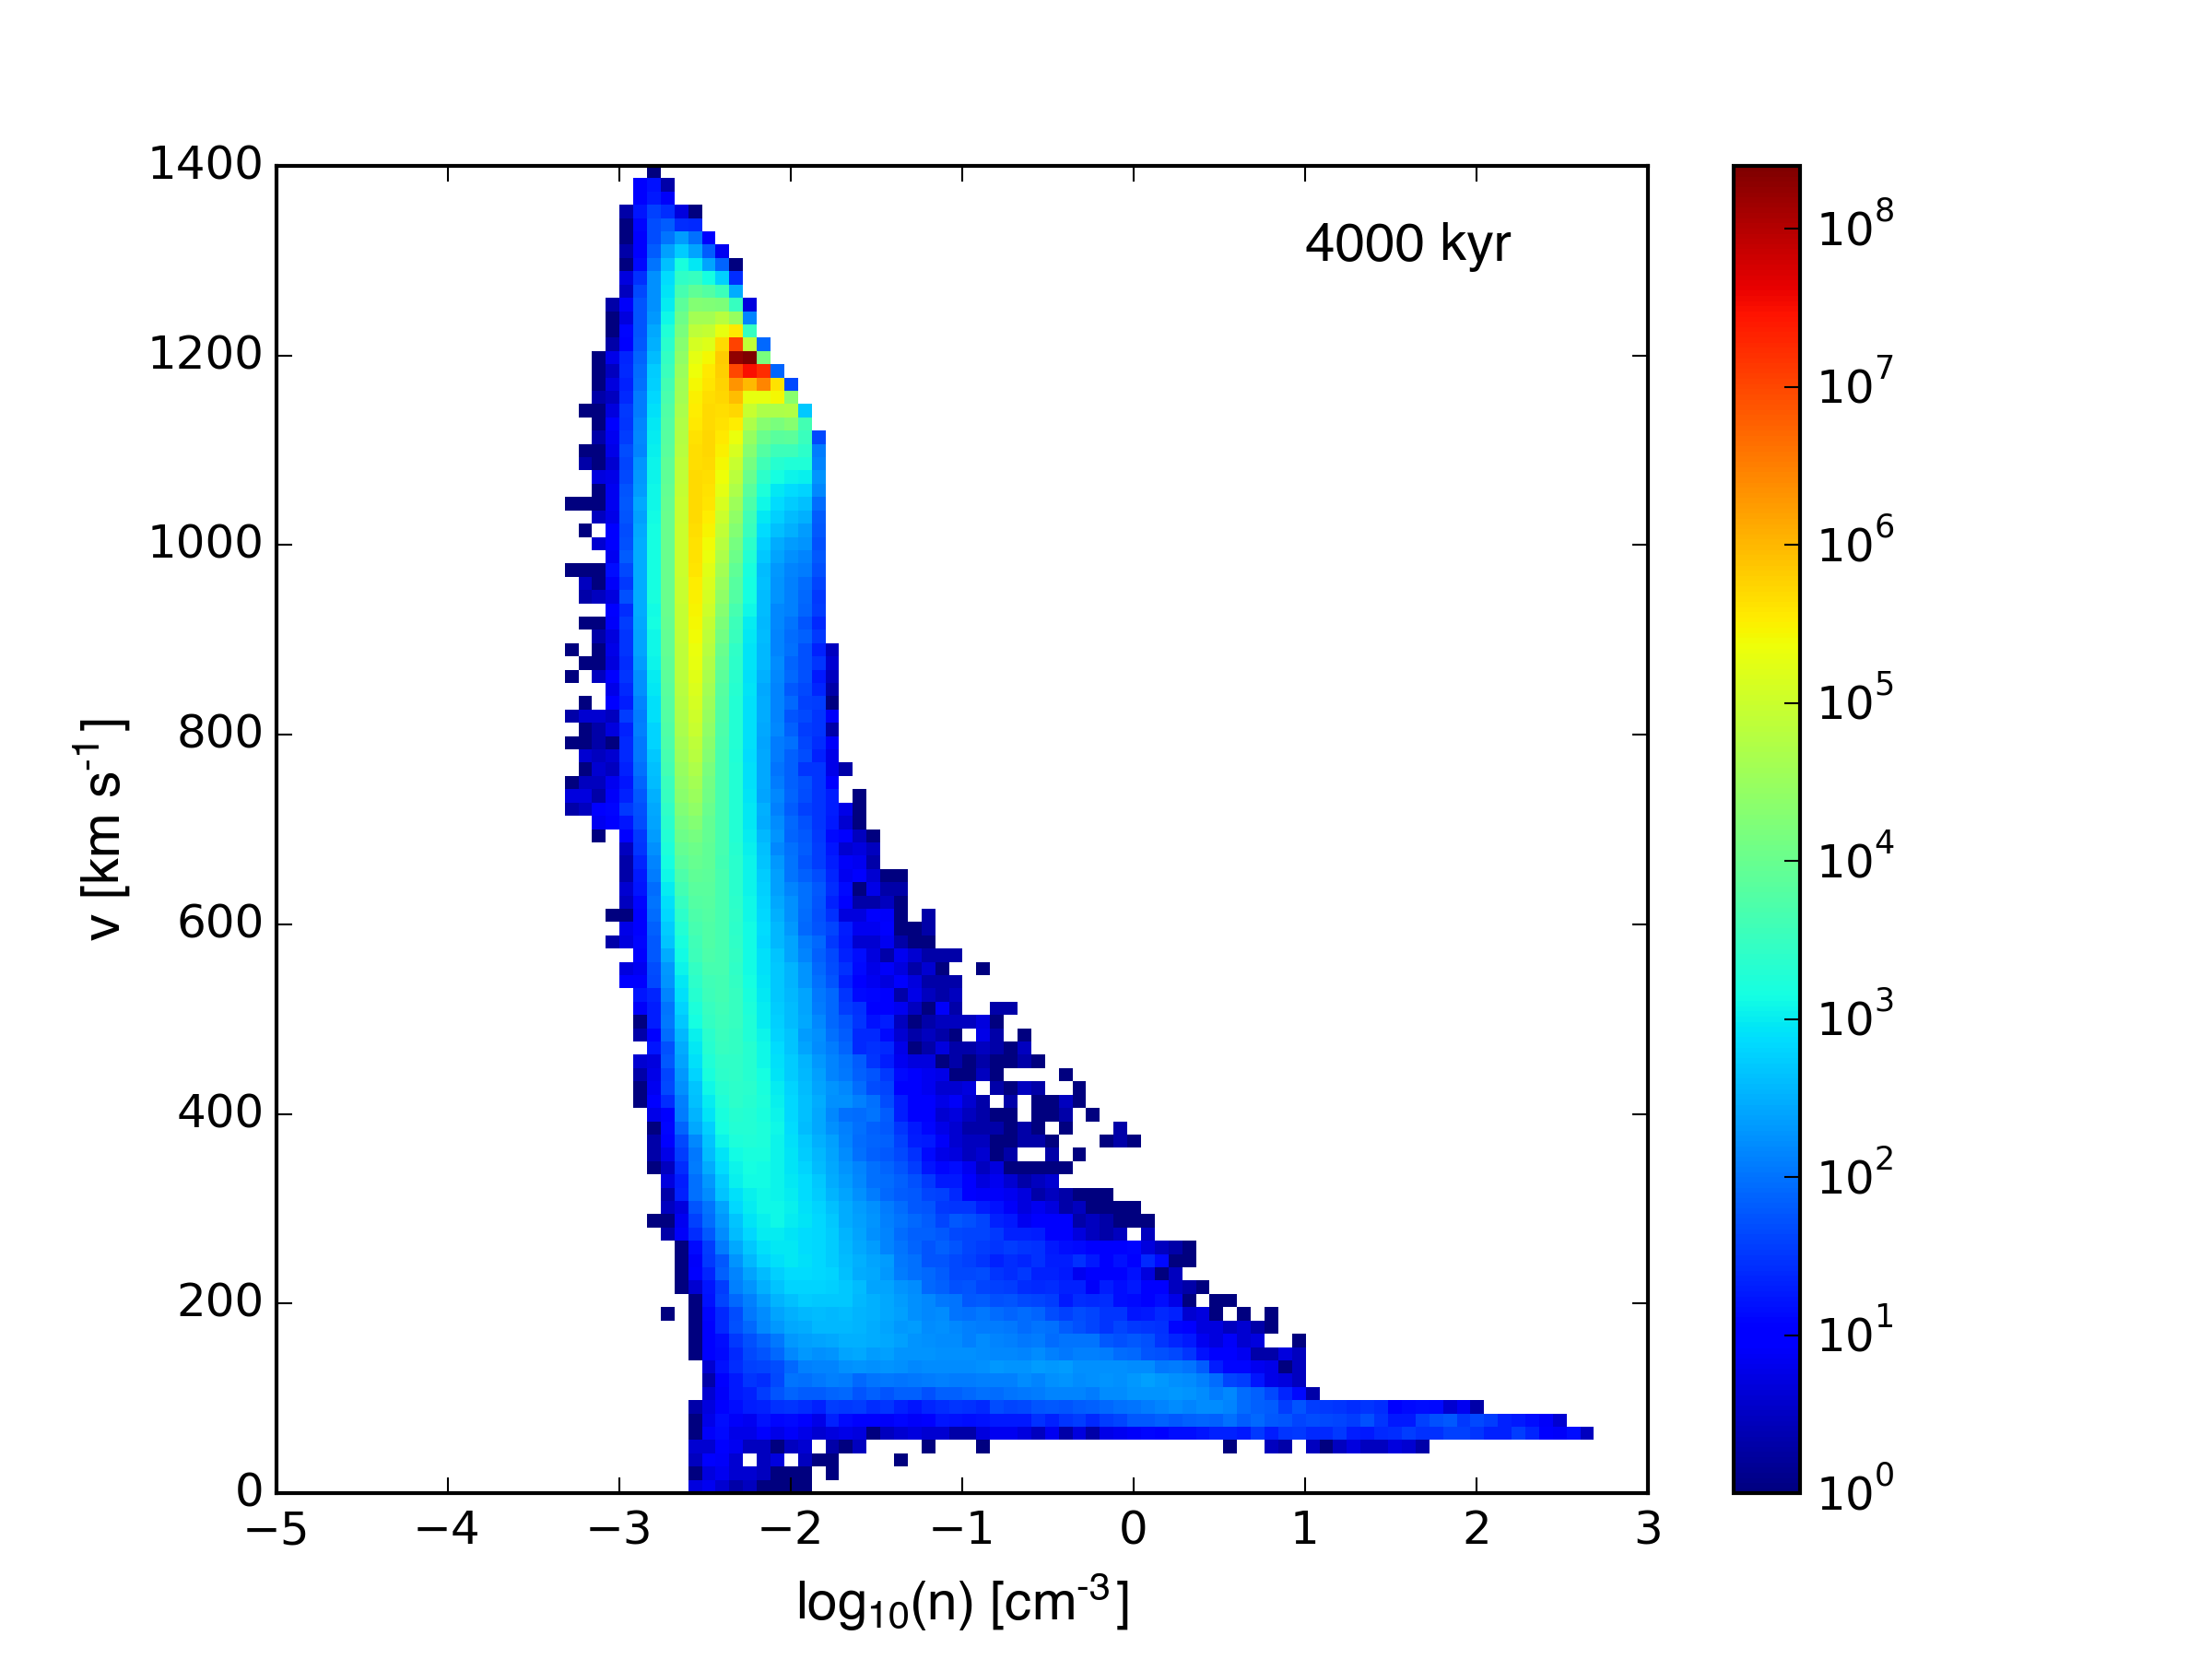
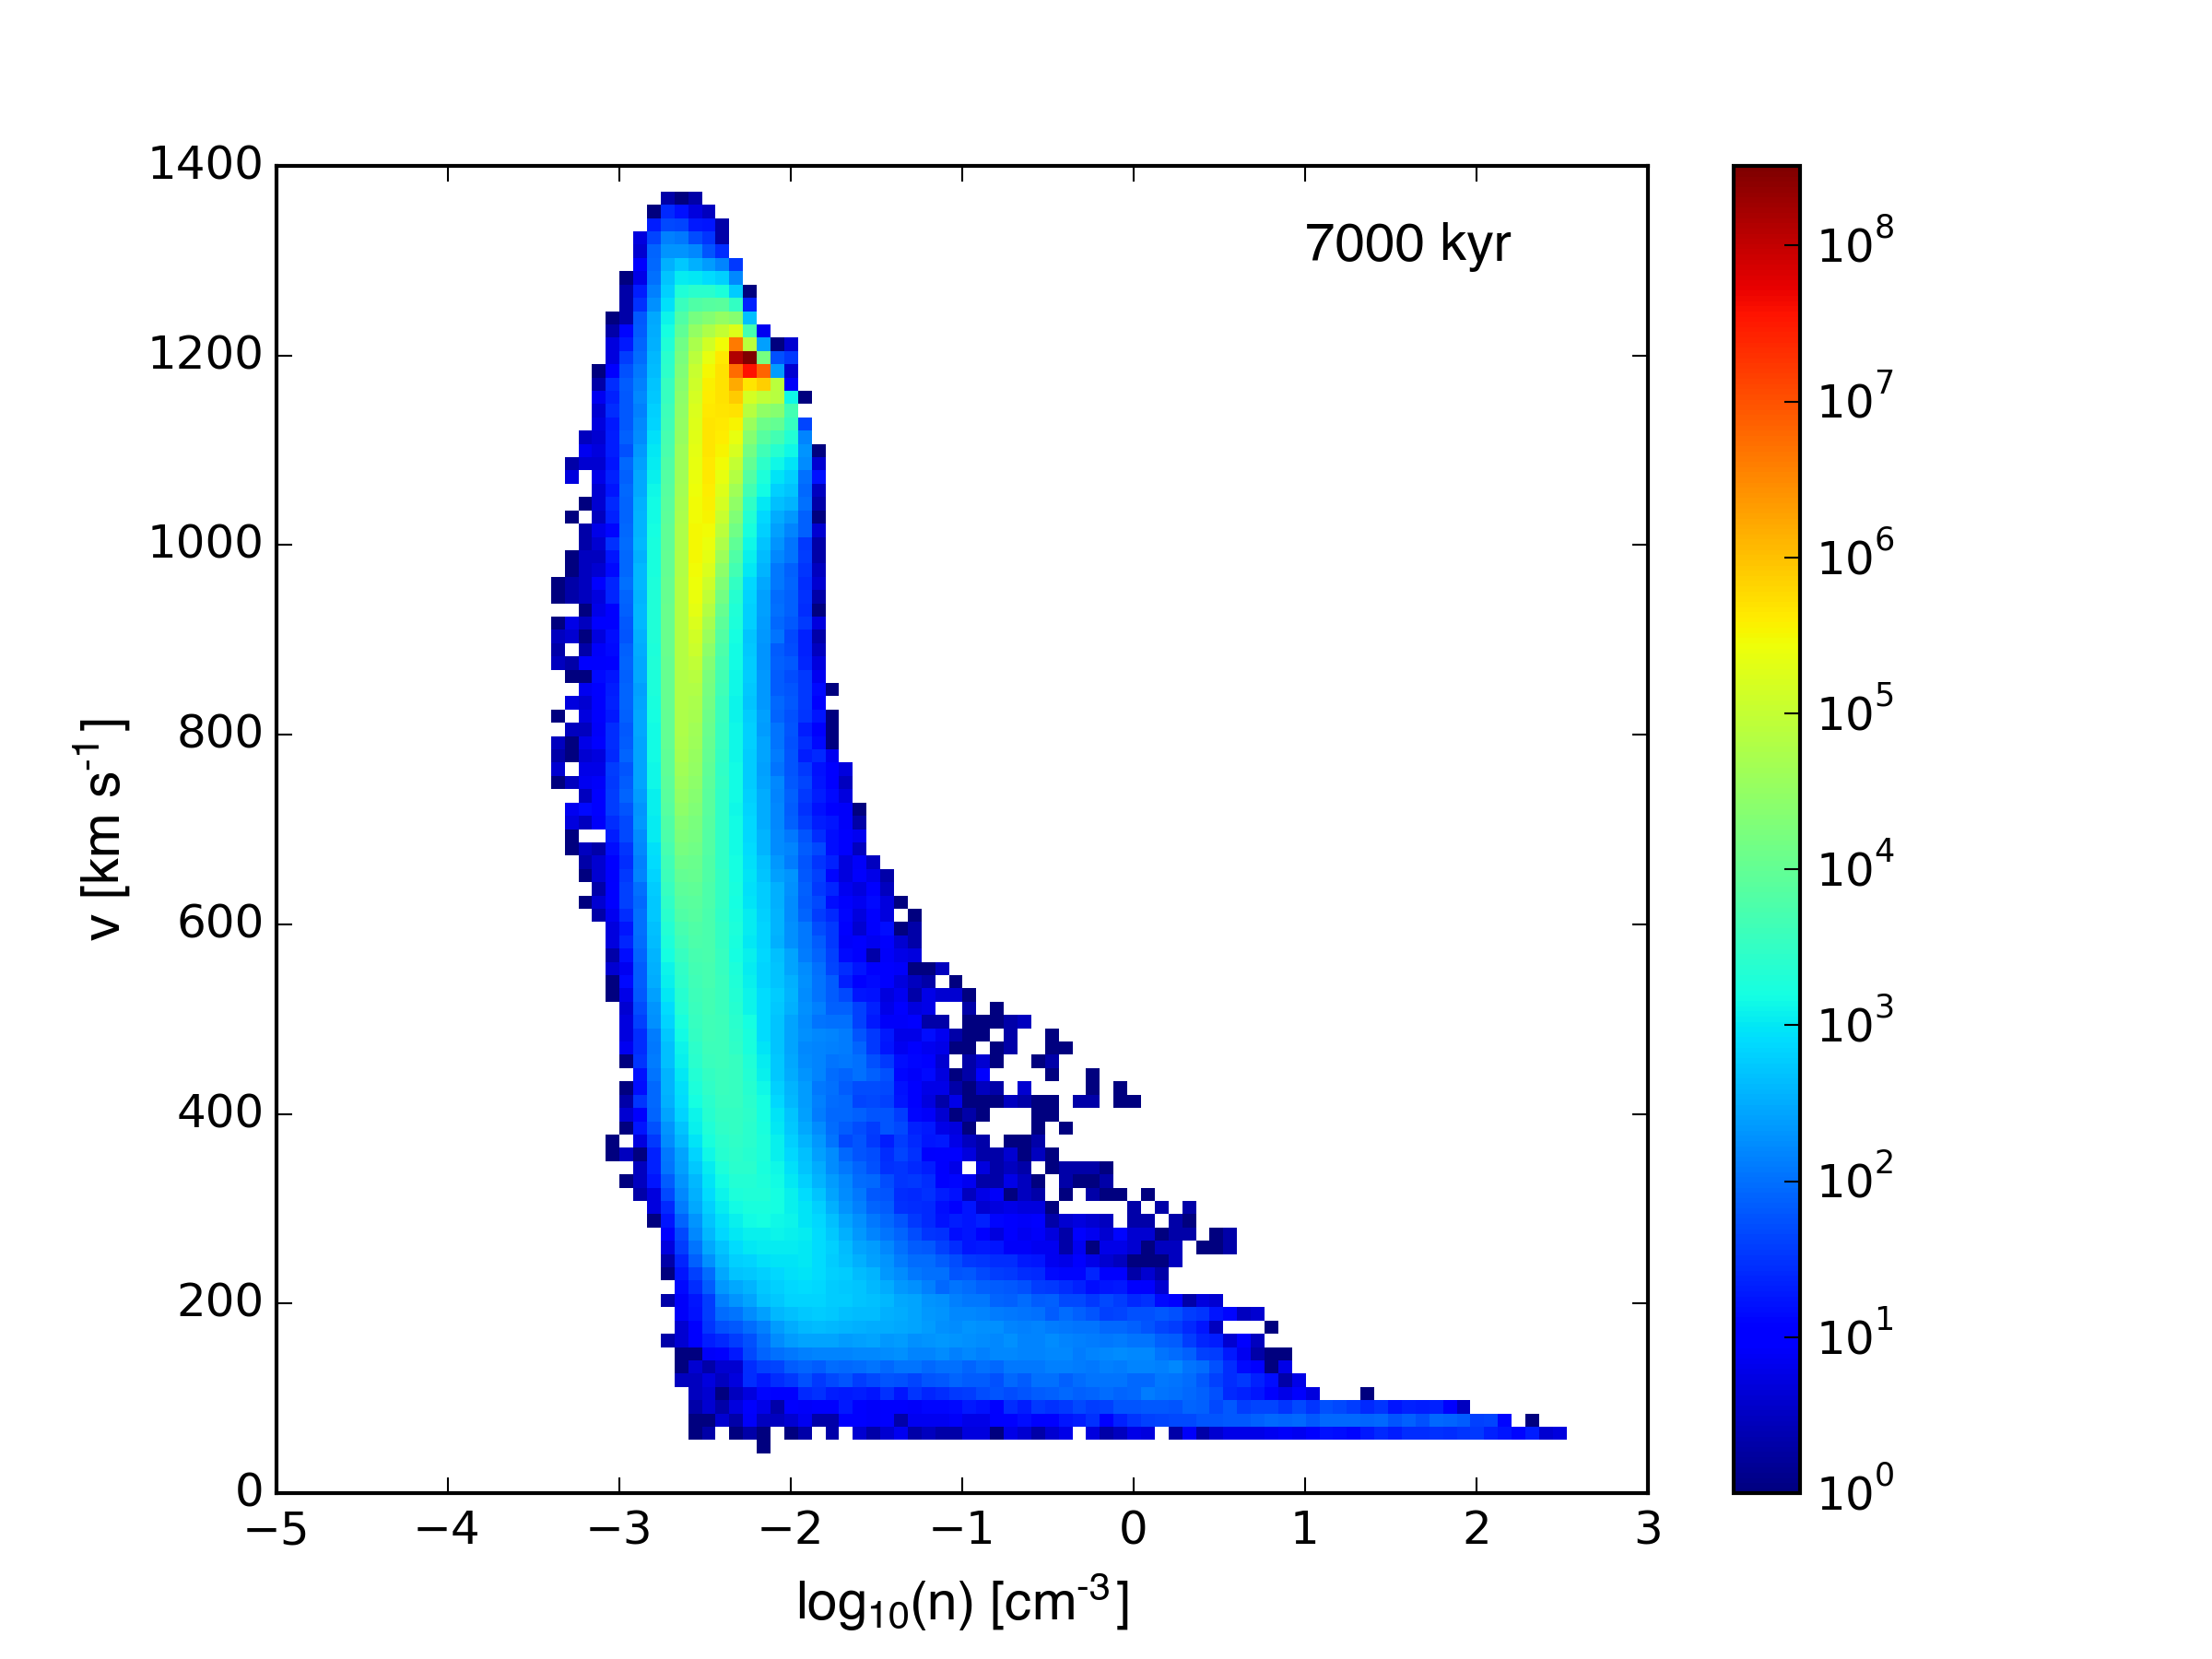
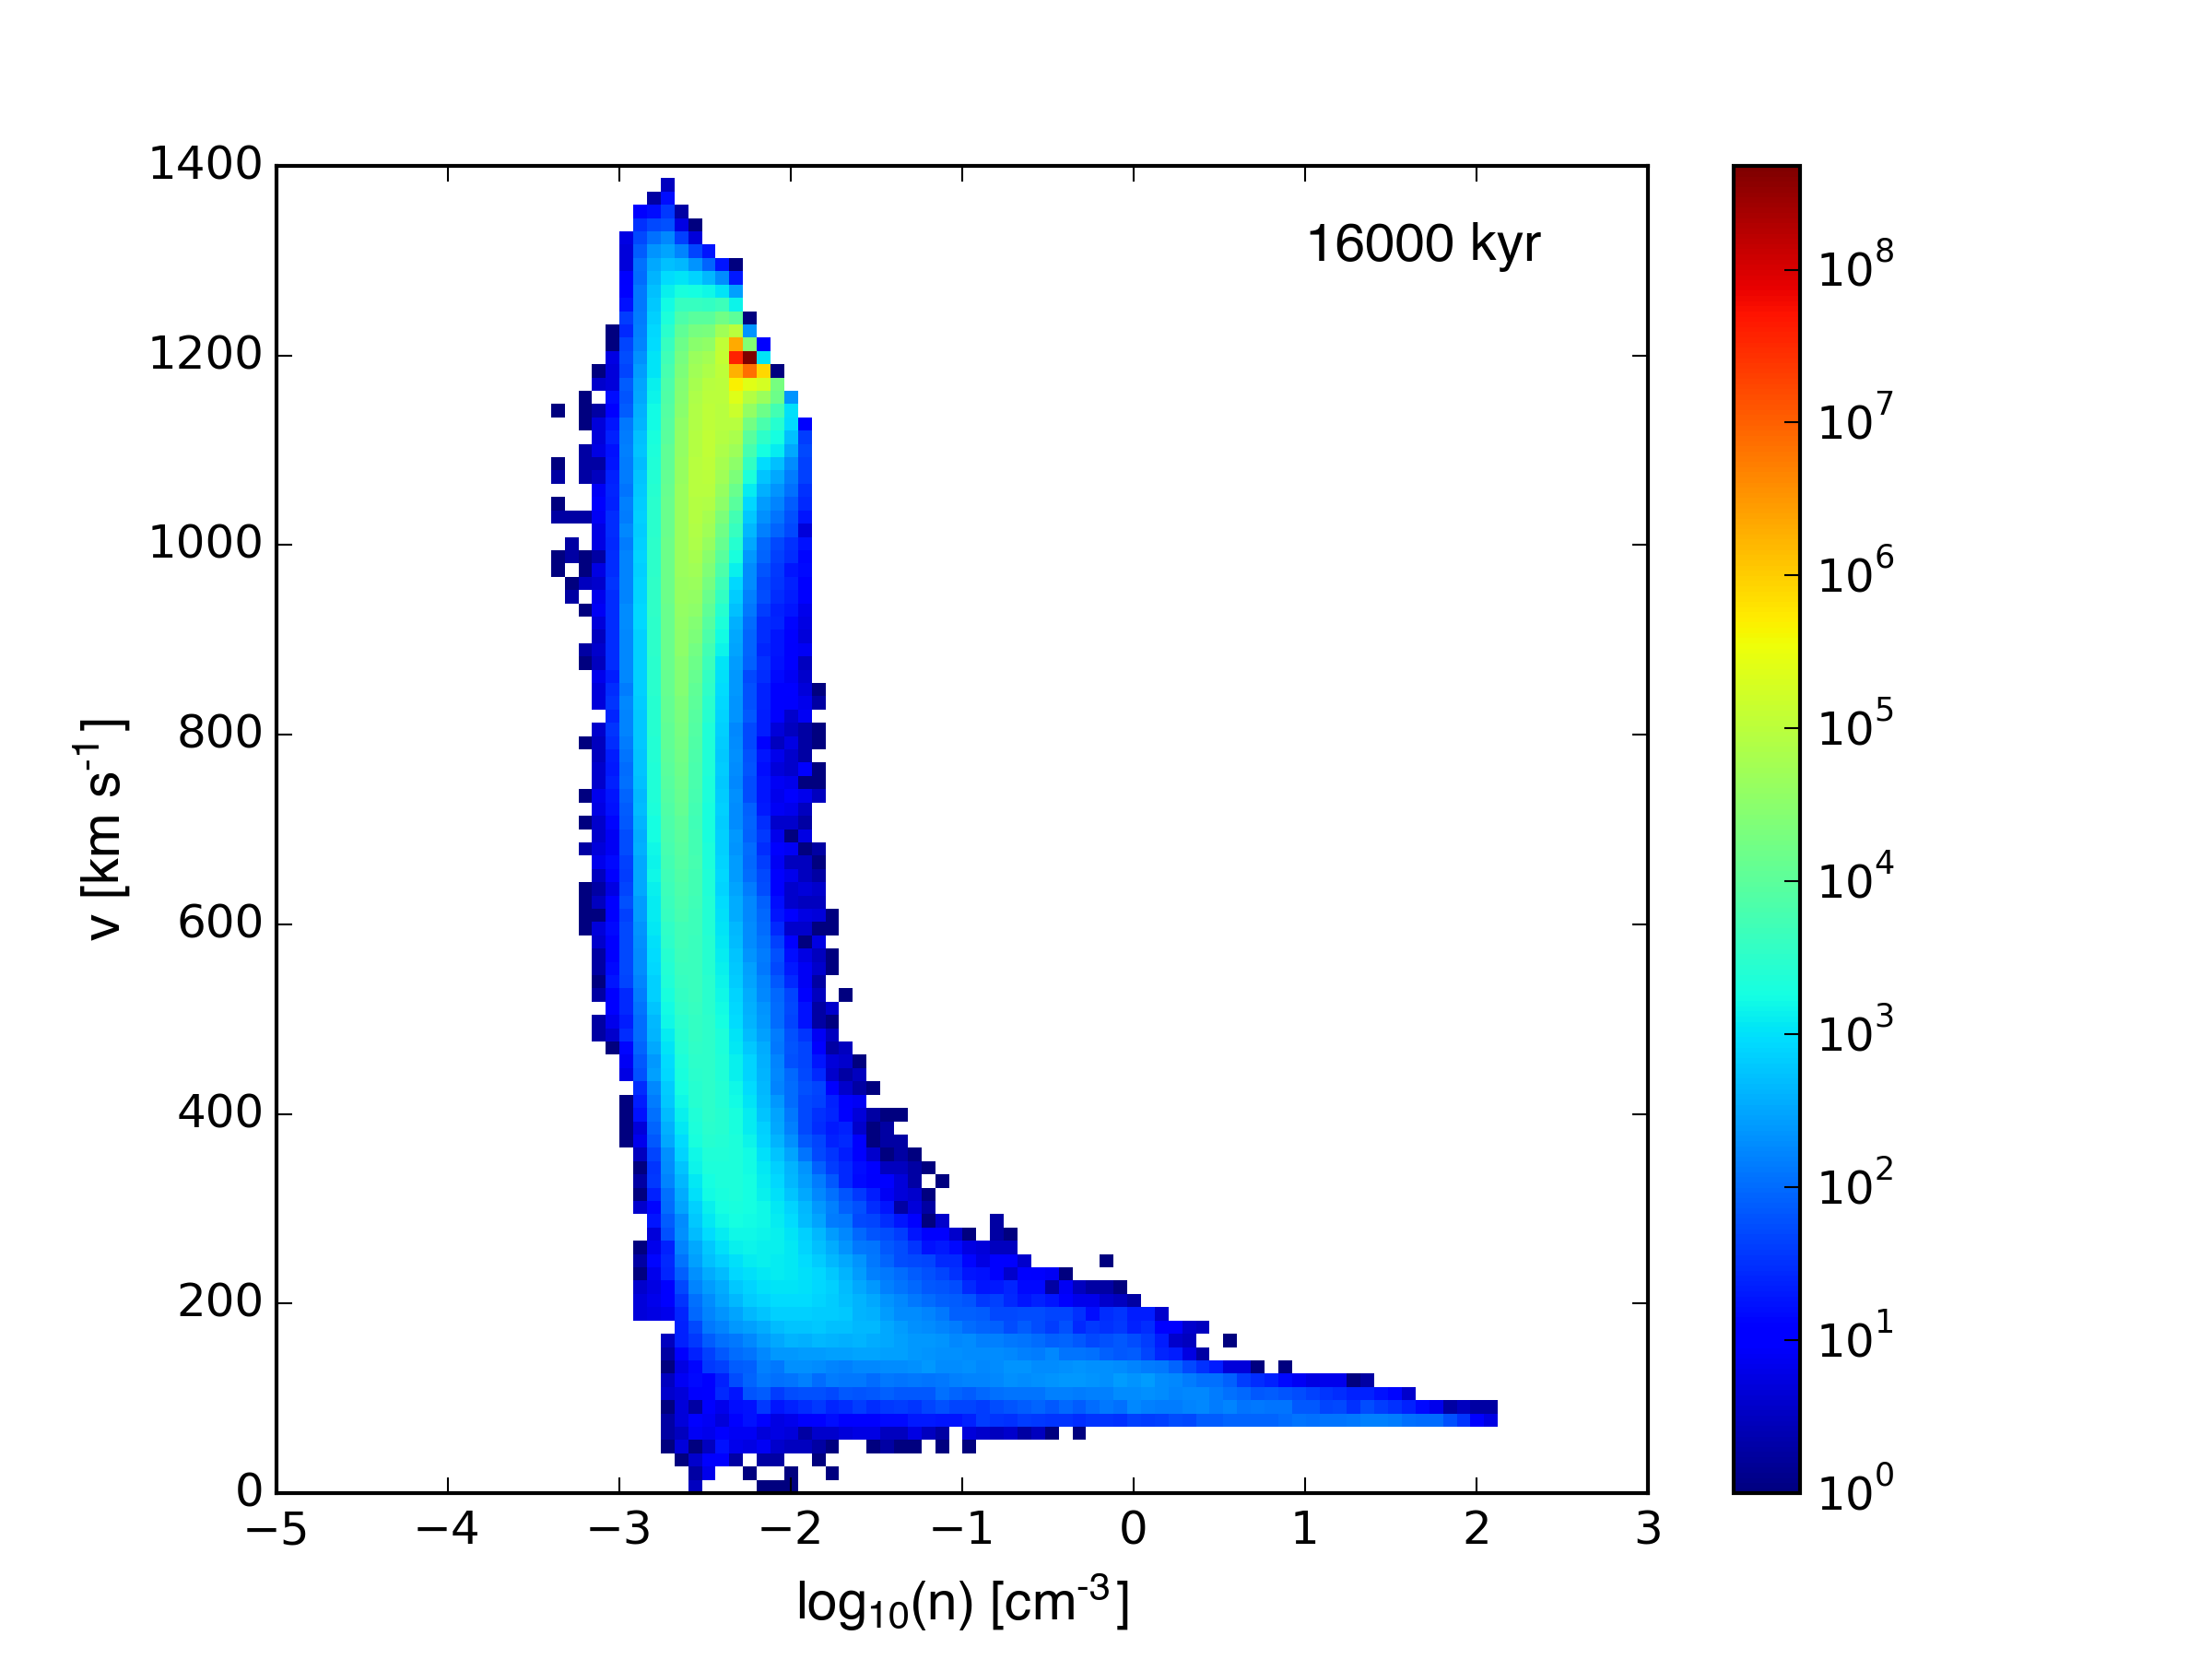
Density-velocity plots: