Sphere vs Cloud
May 9, 2016
The \(\tilde{n} = 1\) high resolution (64 cells / \(R_\mathrm{cl}\)) cloud simulation is now somewhat complete, having reached 1 Myr of evolution. At this point, we can start to make comparisons between the sphere and cloud simulations.
Below is a plot showing the mass evolution of the high resolution sphere and cloud simulations. A few of the low resolution sphere sims are plotted, as well.
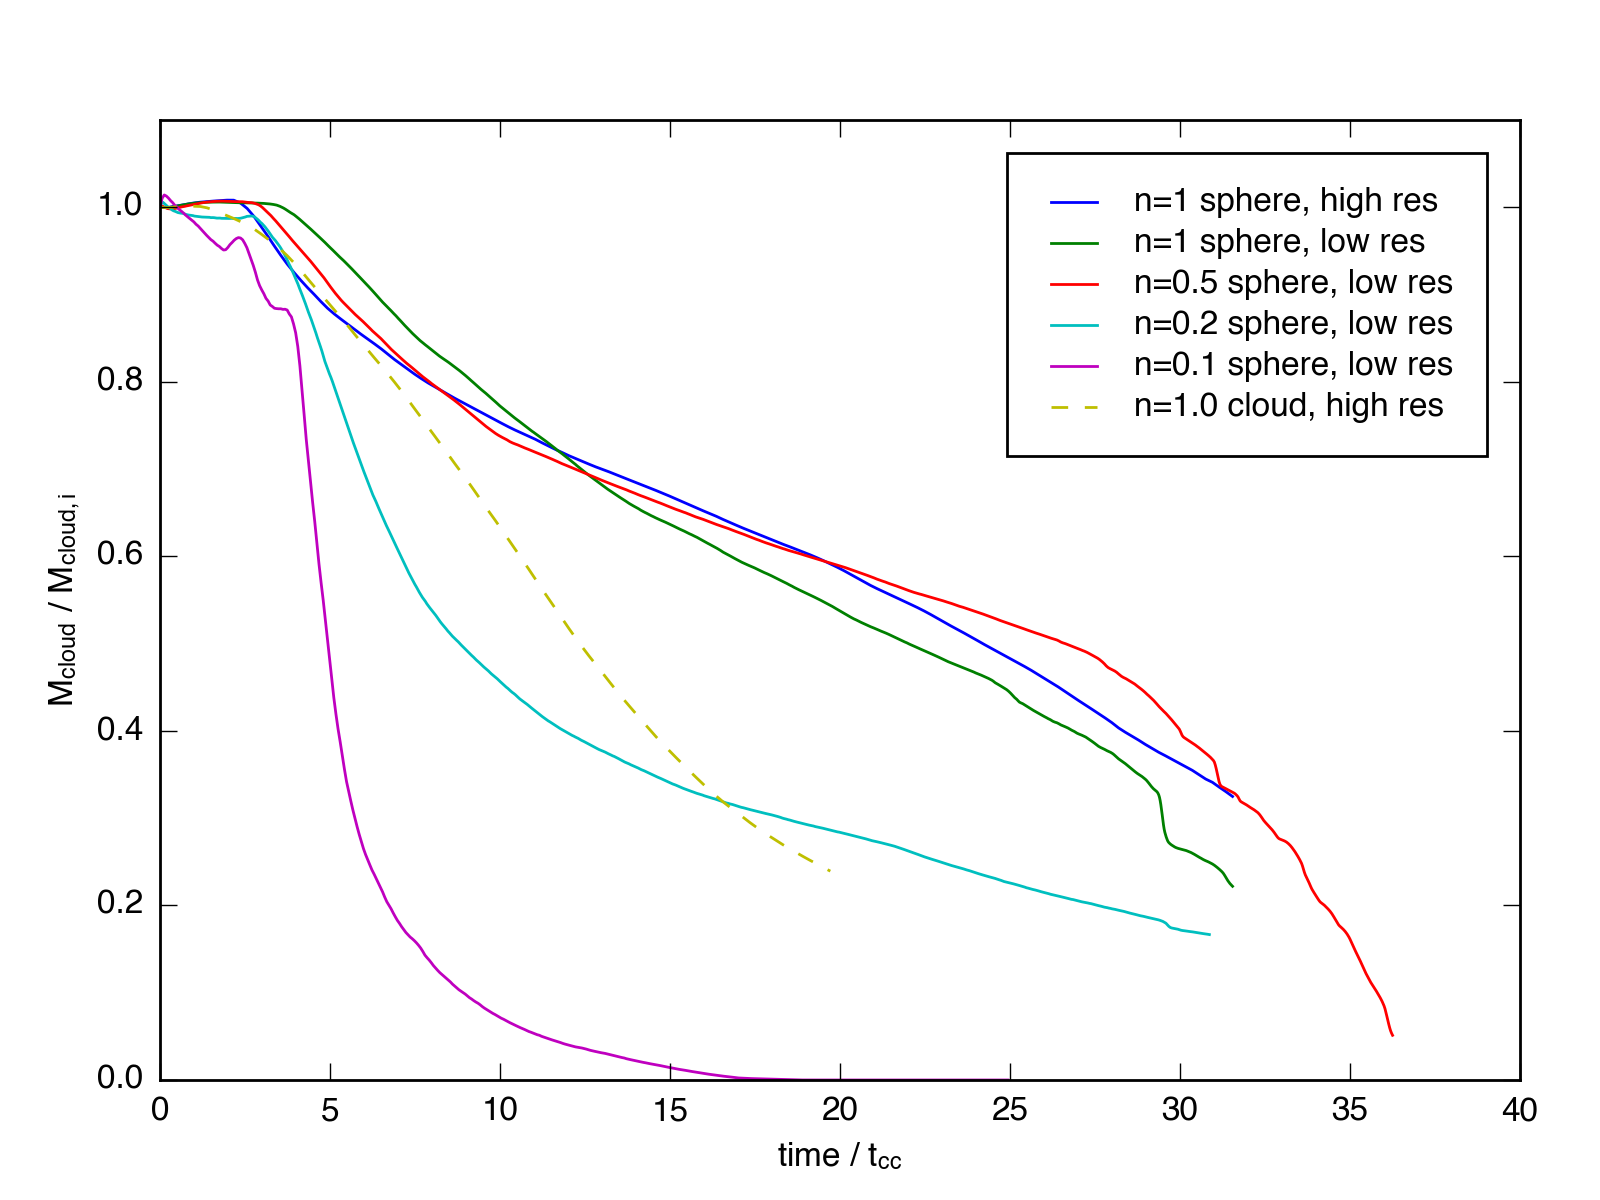
Clearly, the cloud’s mass loss is accelerated with respect to the sphere.
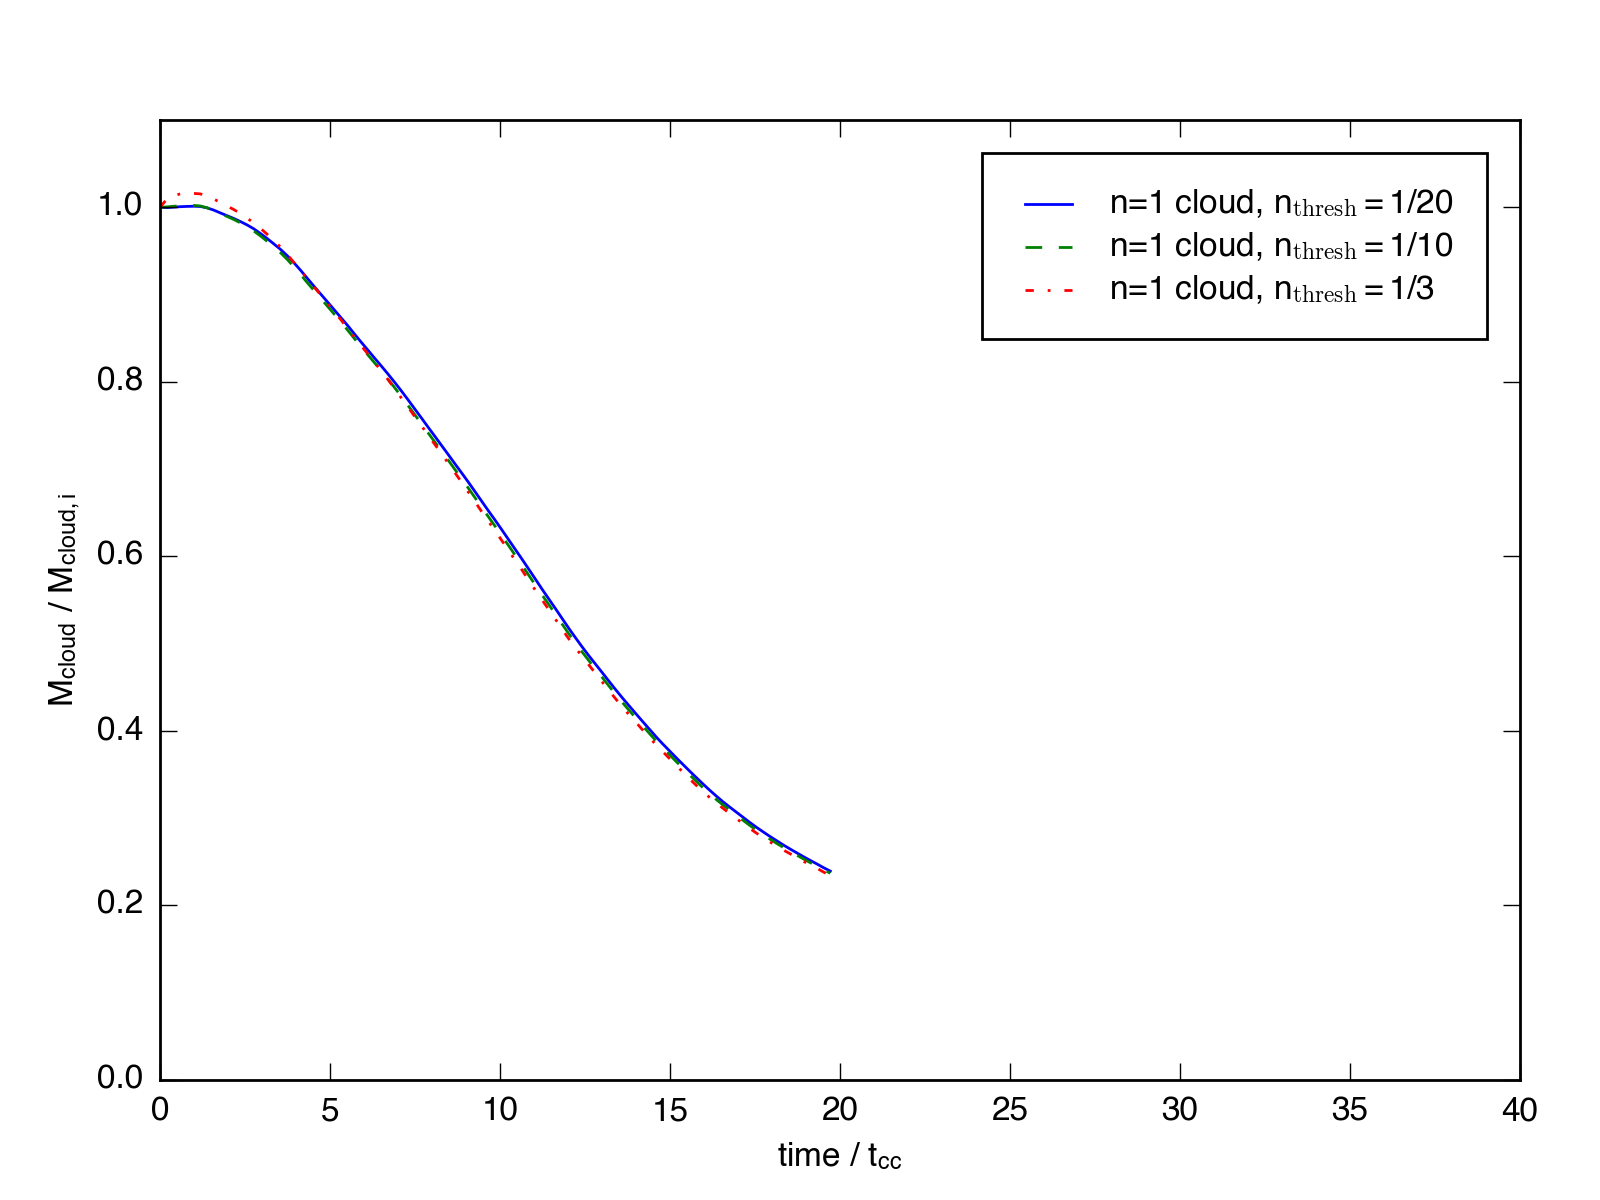
An initial question might be how the mass threshold I used to calculate the total mass affects these lines. Previously, I showed that the sphere evolution was insensitive to thresholds set at 1/20th, 1/10th, and 1/3rd the initial median density. Perhaps surprisingly, the same is true for the \(\tilde{n} = 1\) cloud:
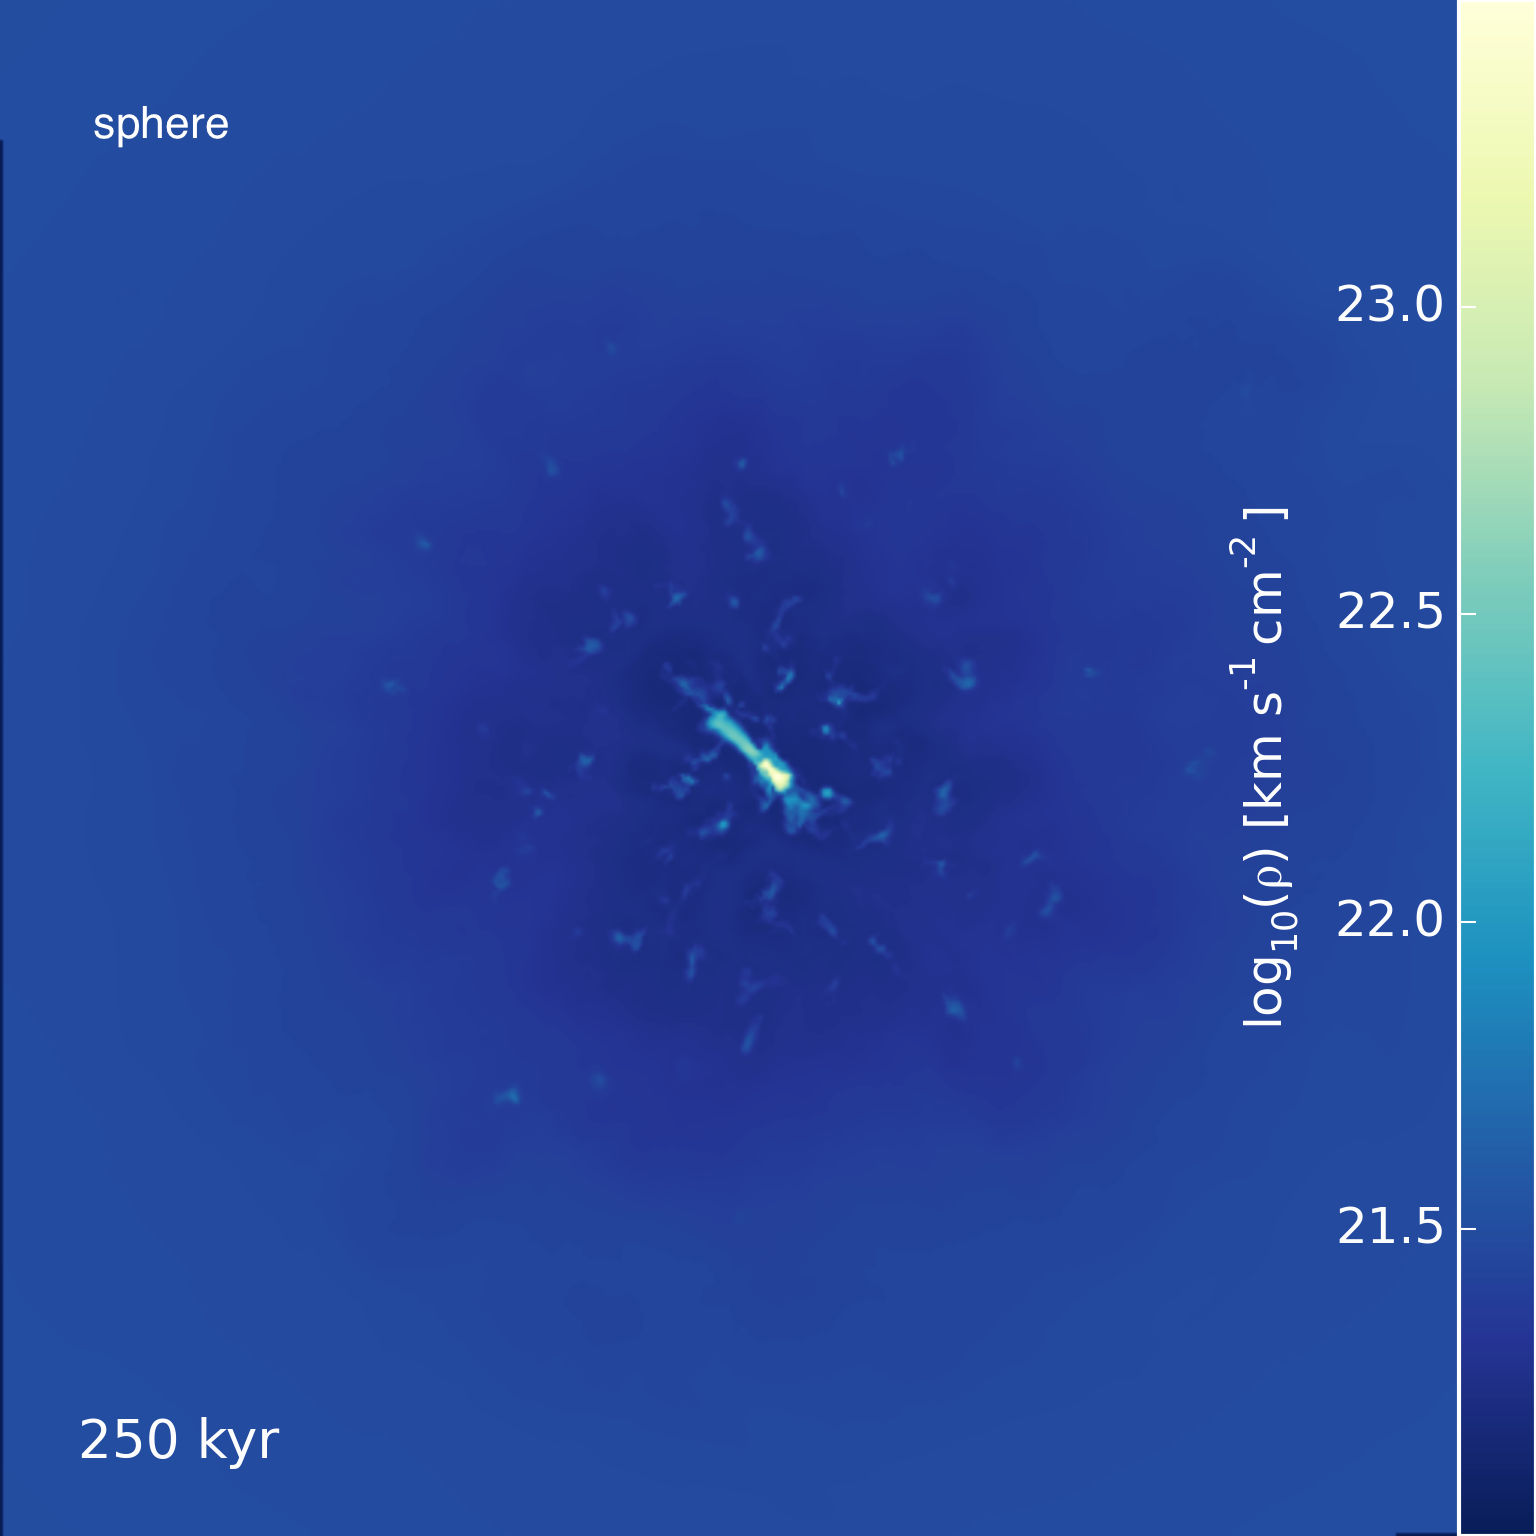
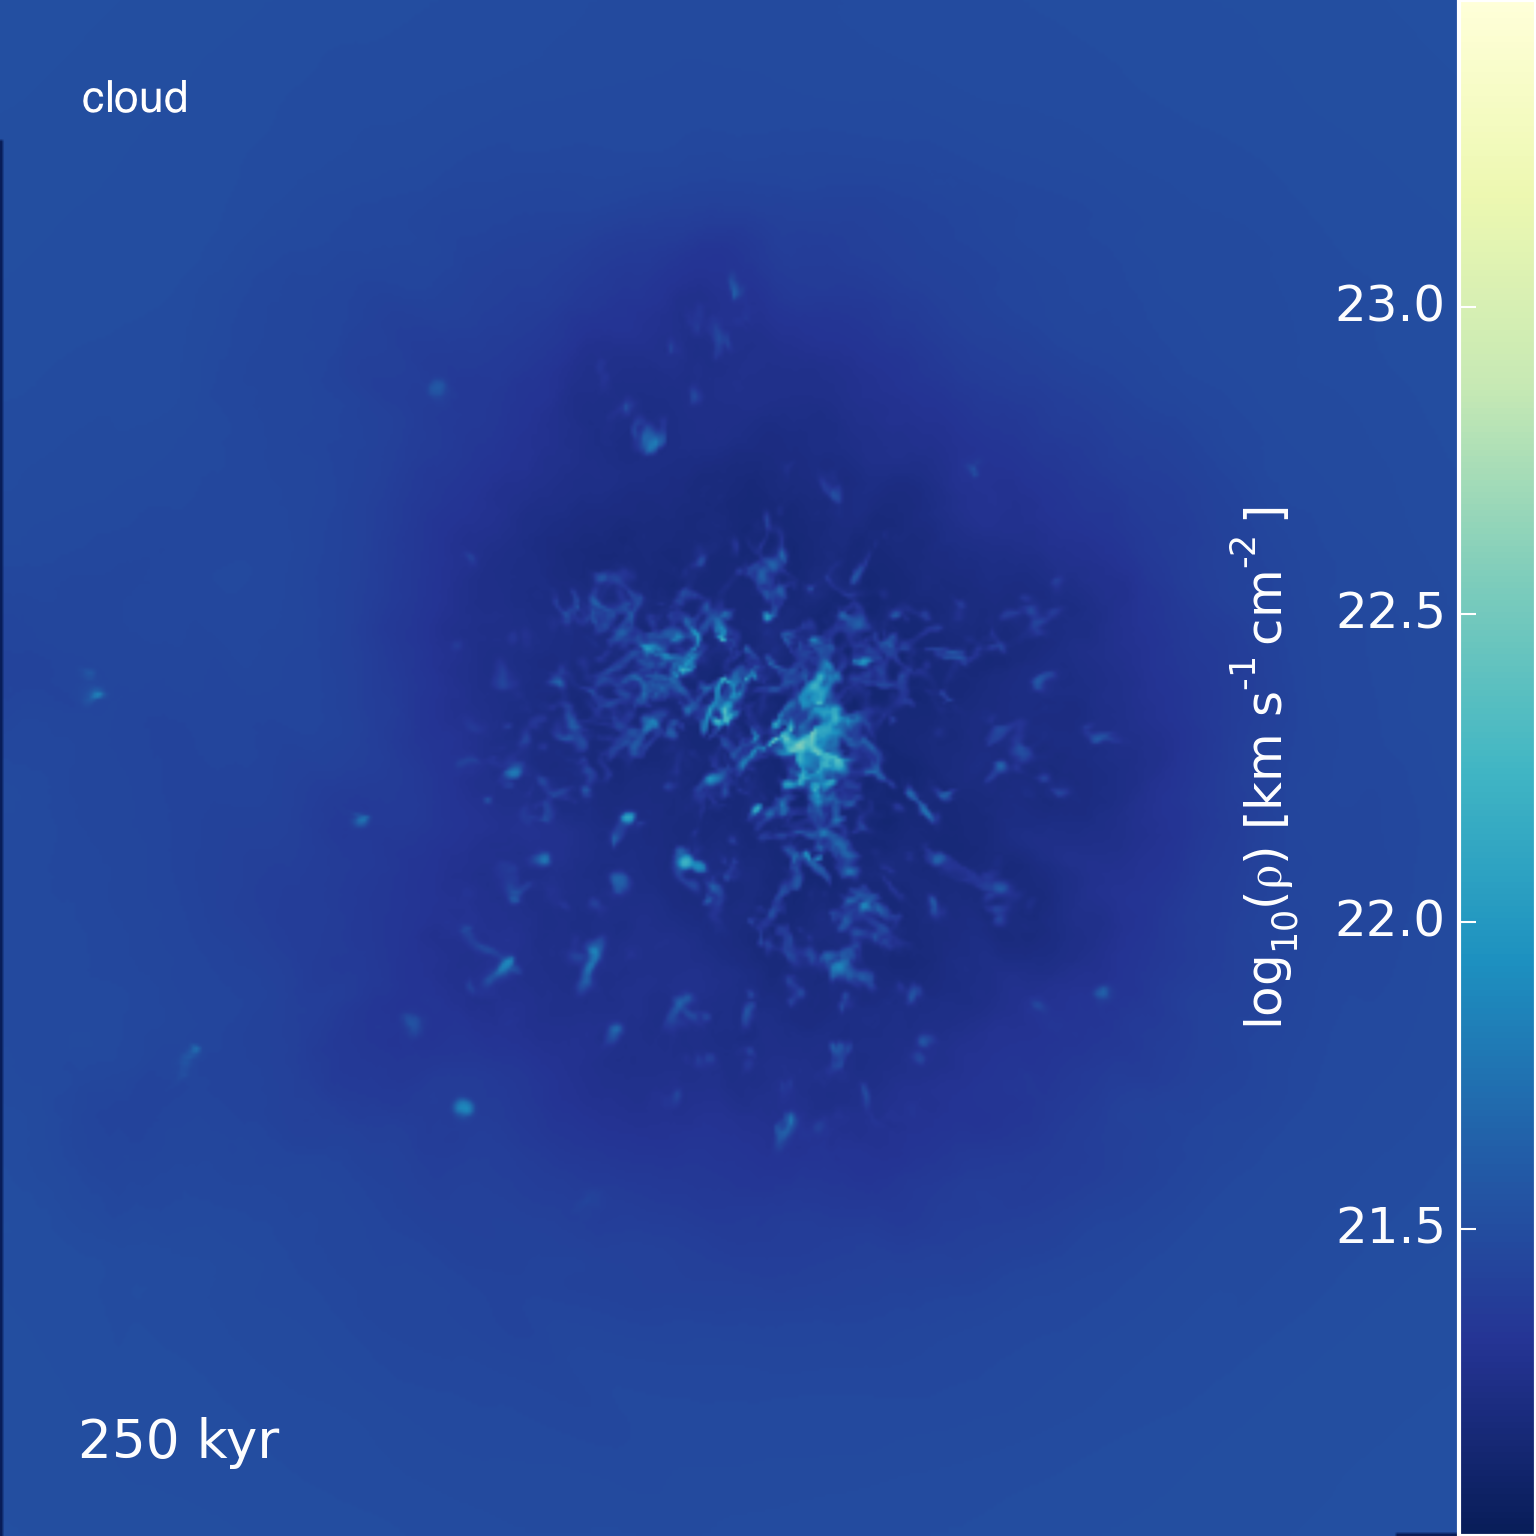
We can also look at the phase diagrams for the simulations. Below are mass-weighted density-temperature and density-velocity diagrams for each simulation at \(\sim 5 t_\mathrm{cc}\).
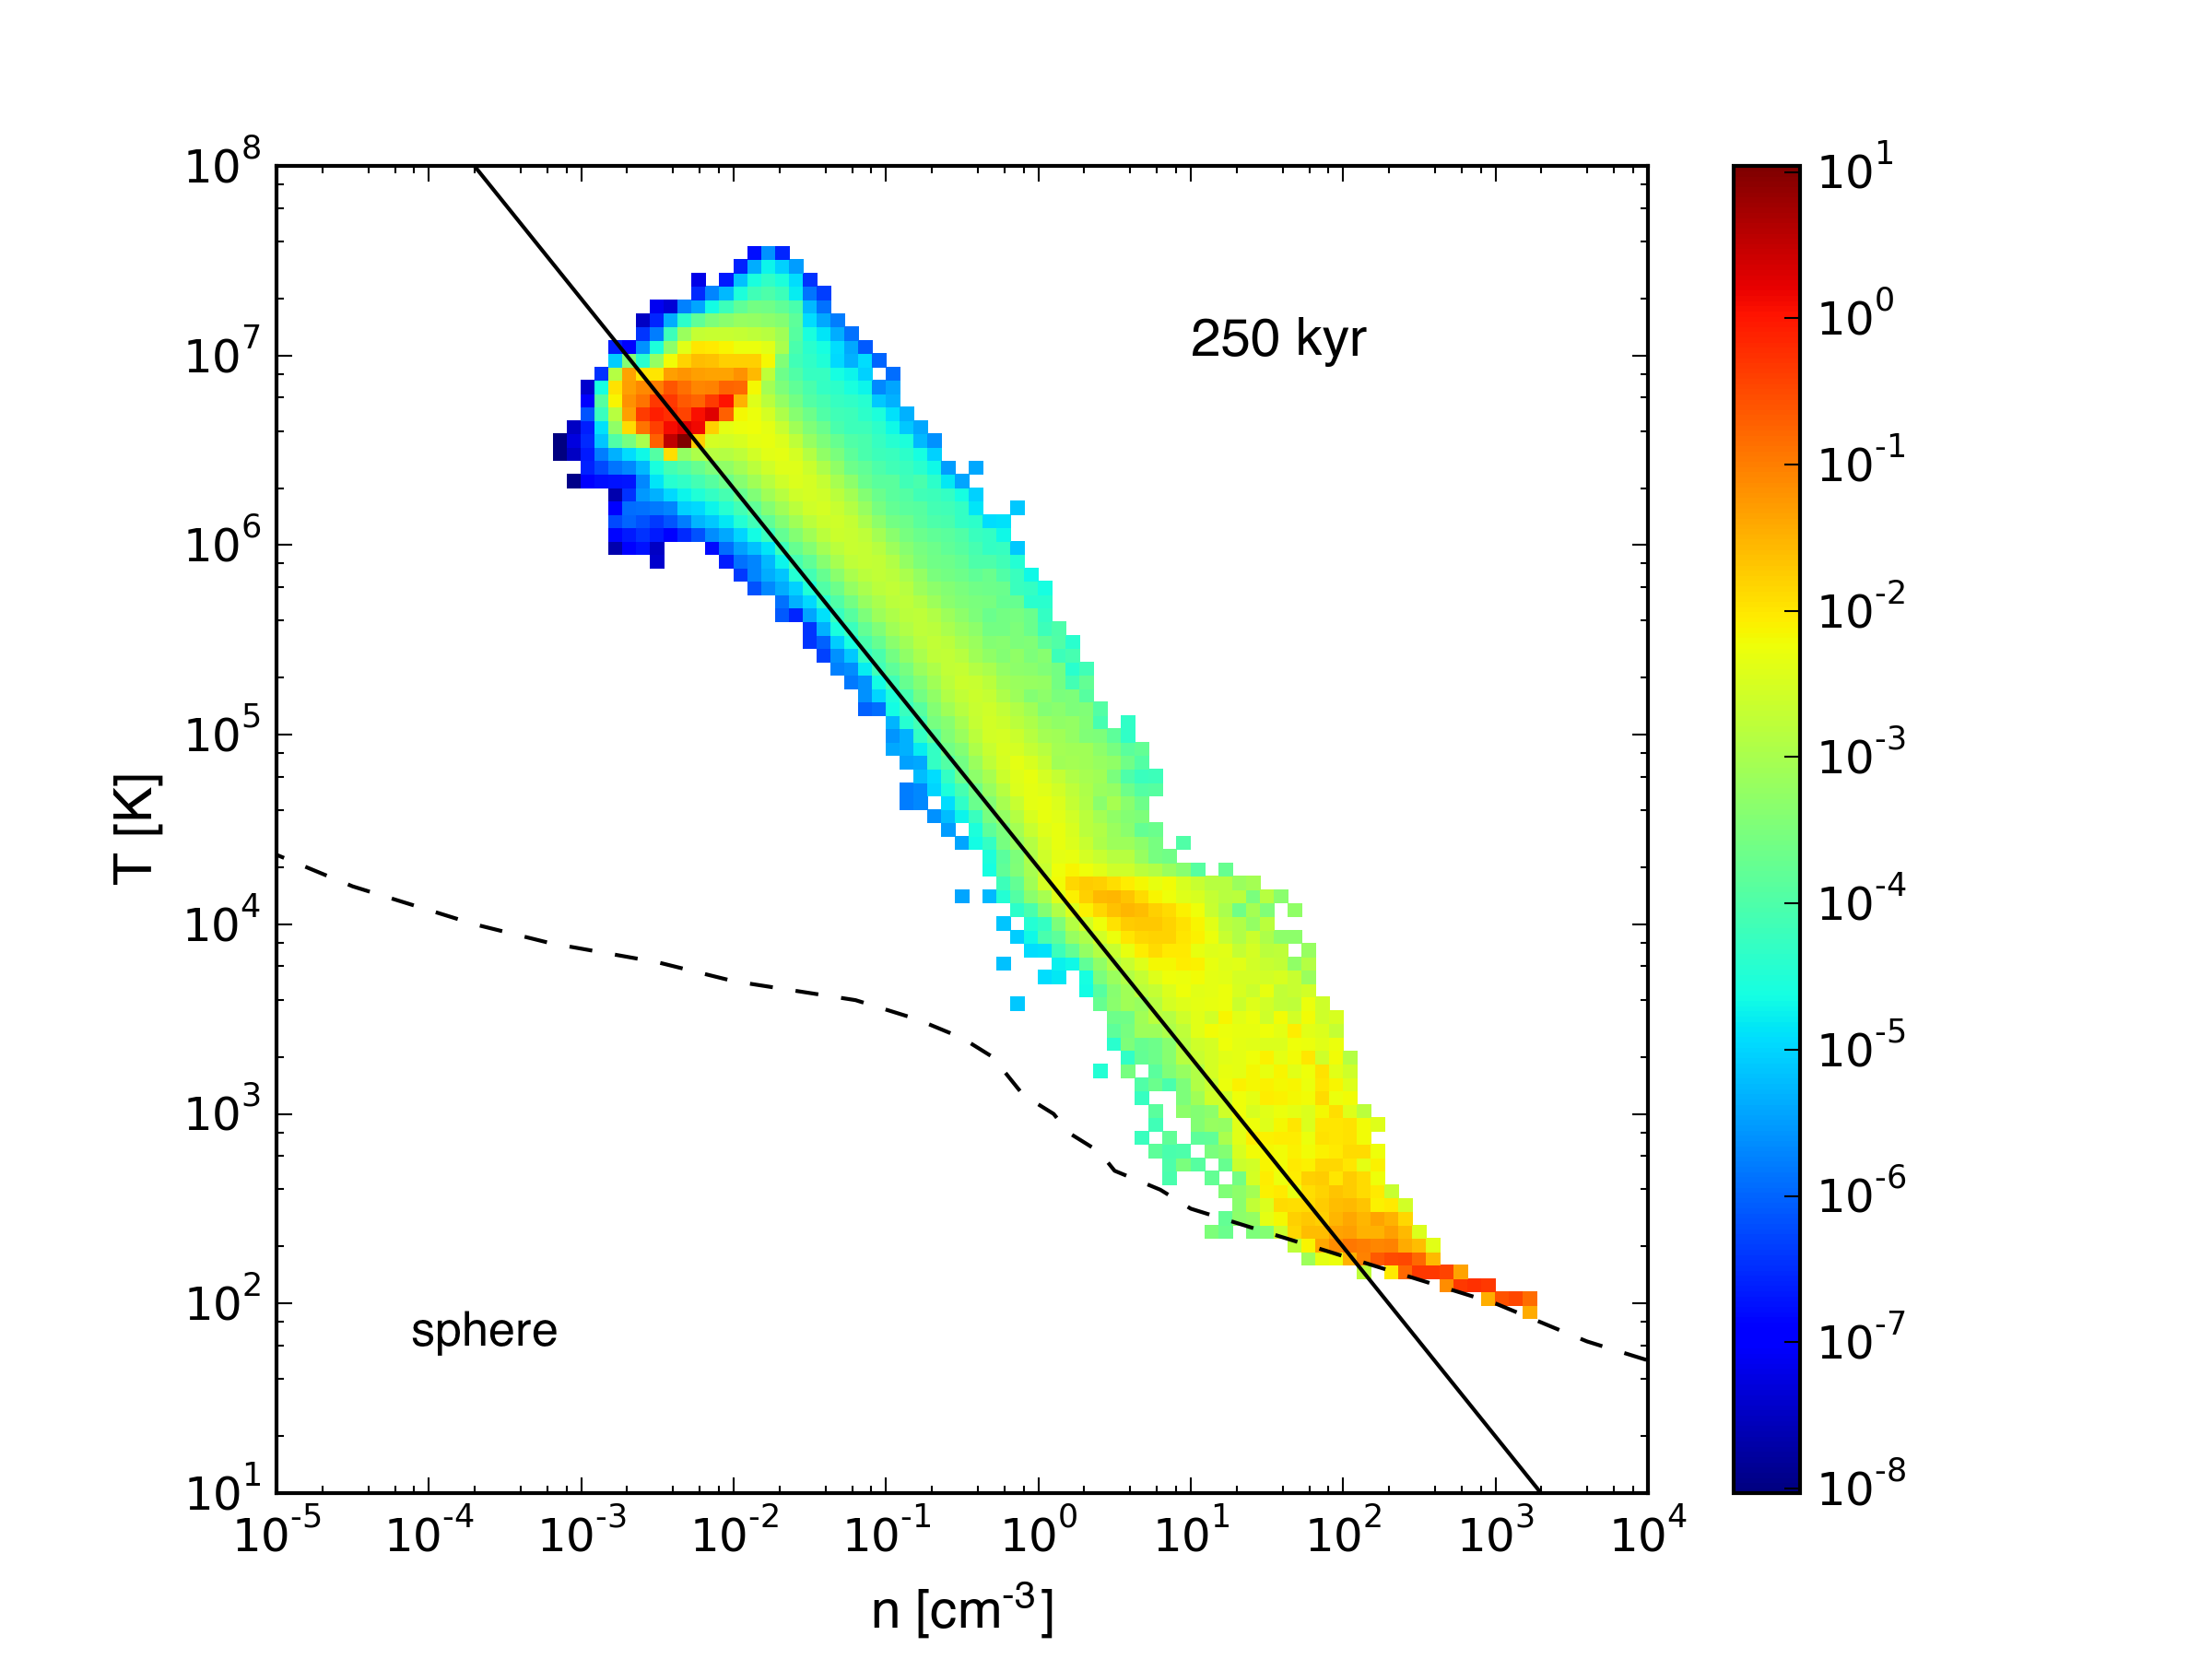
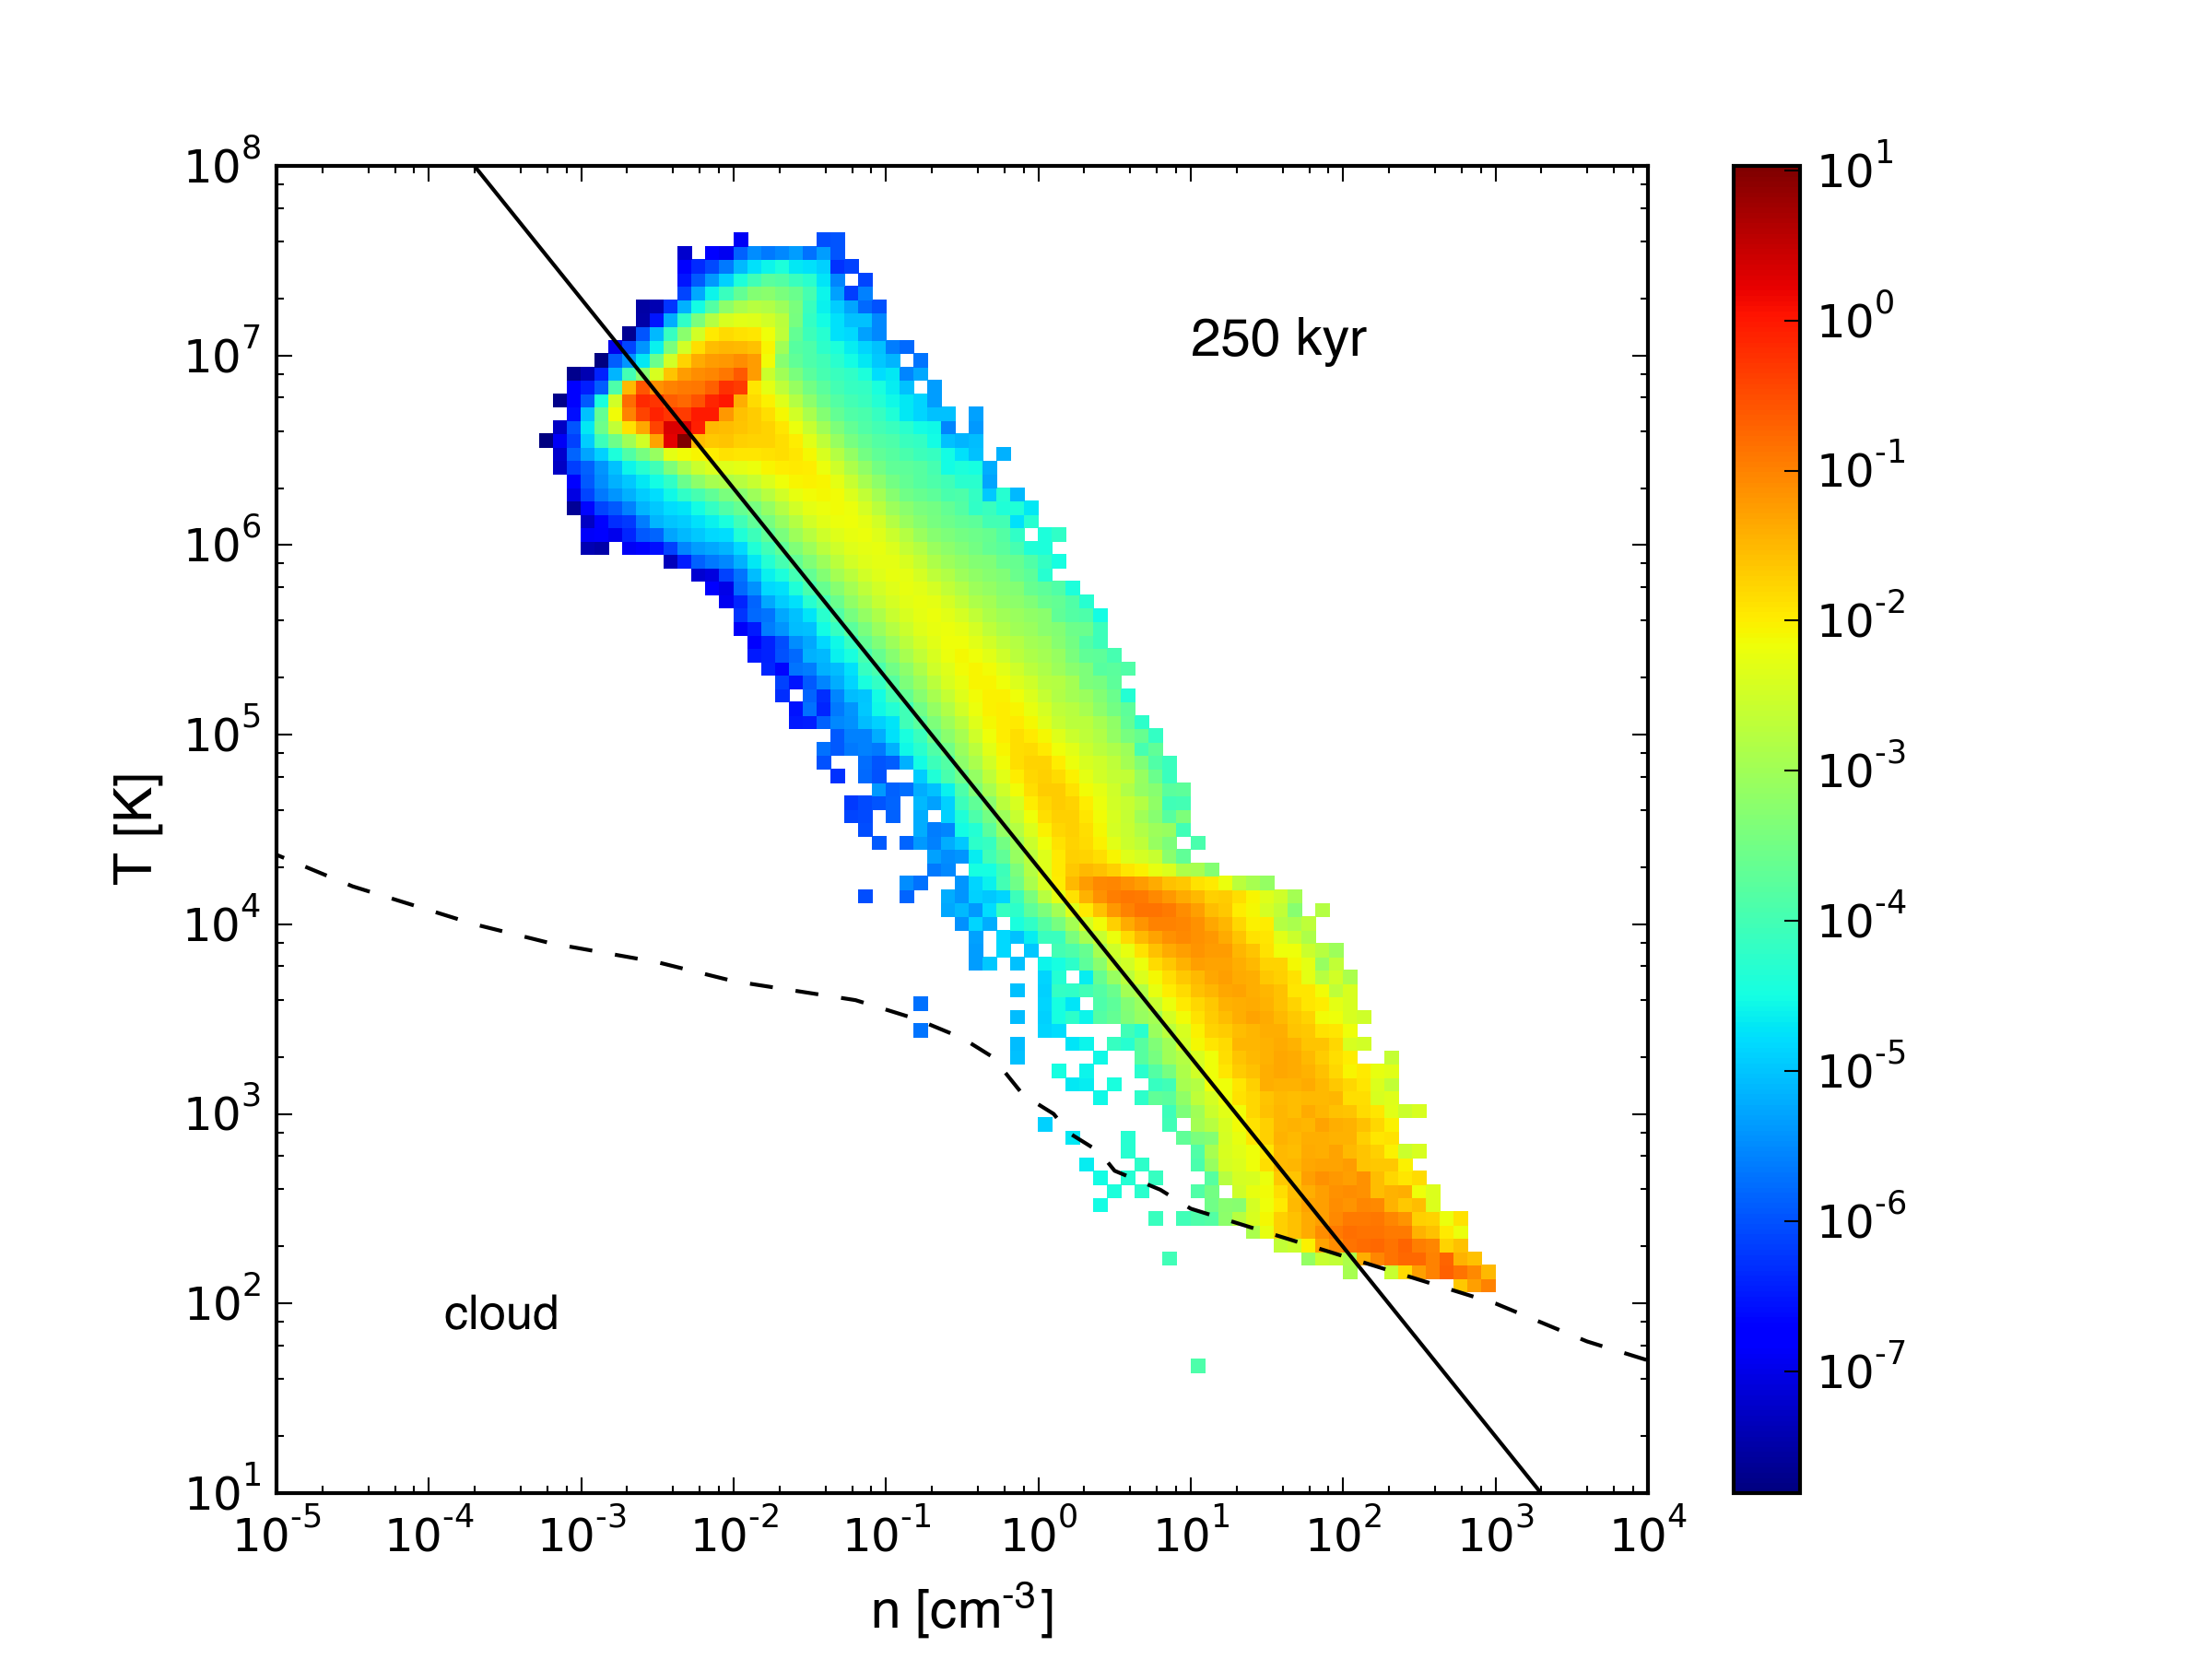
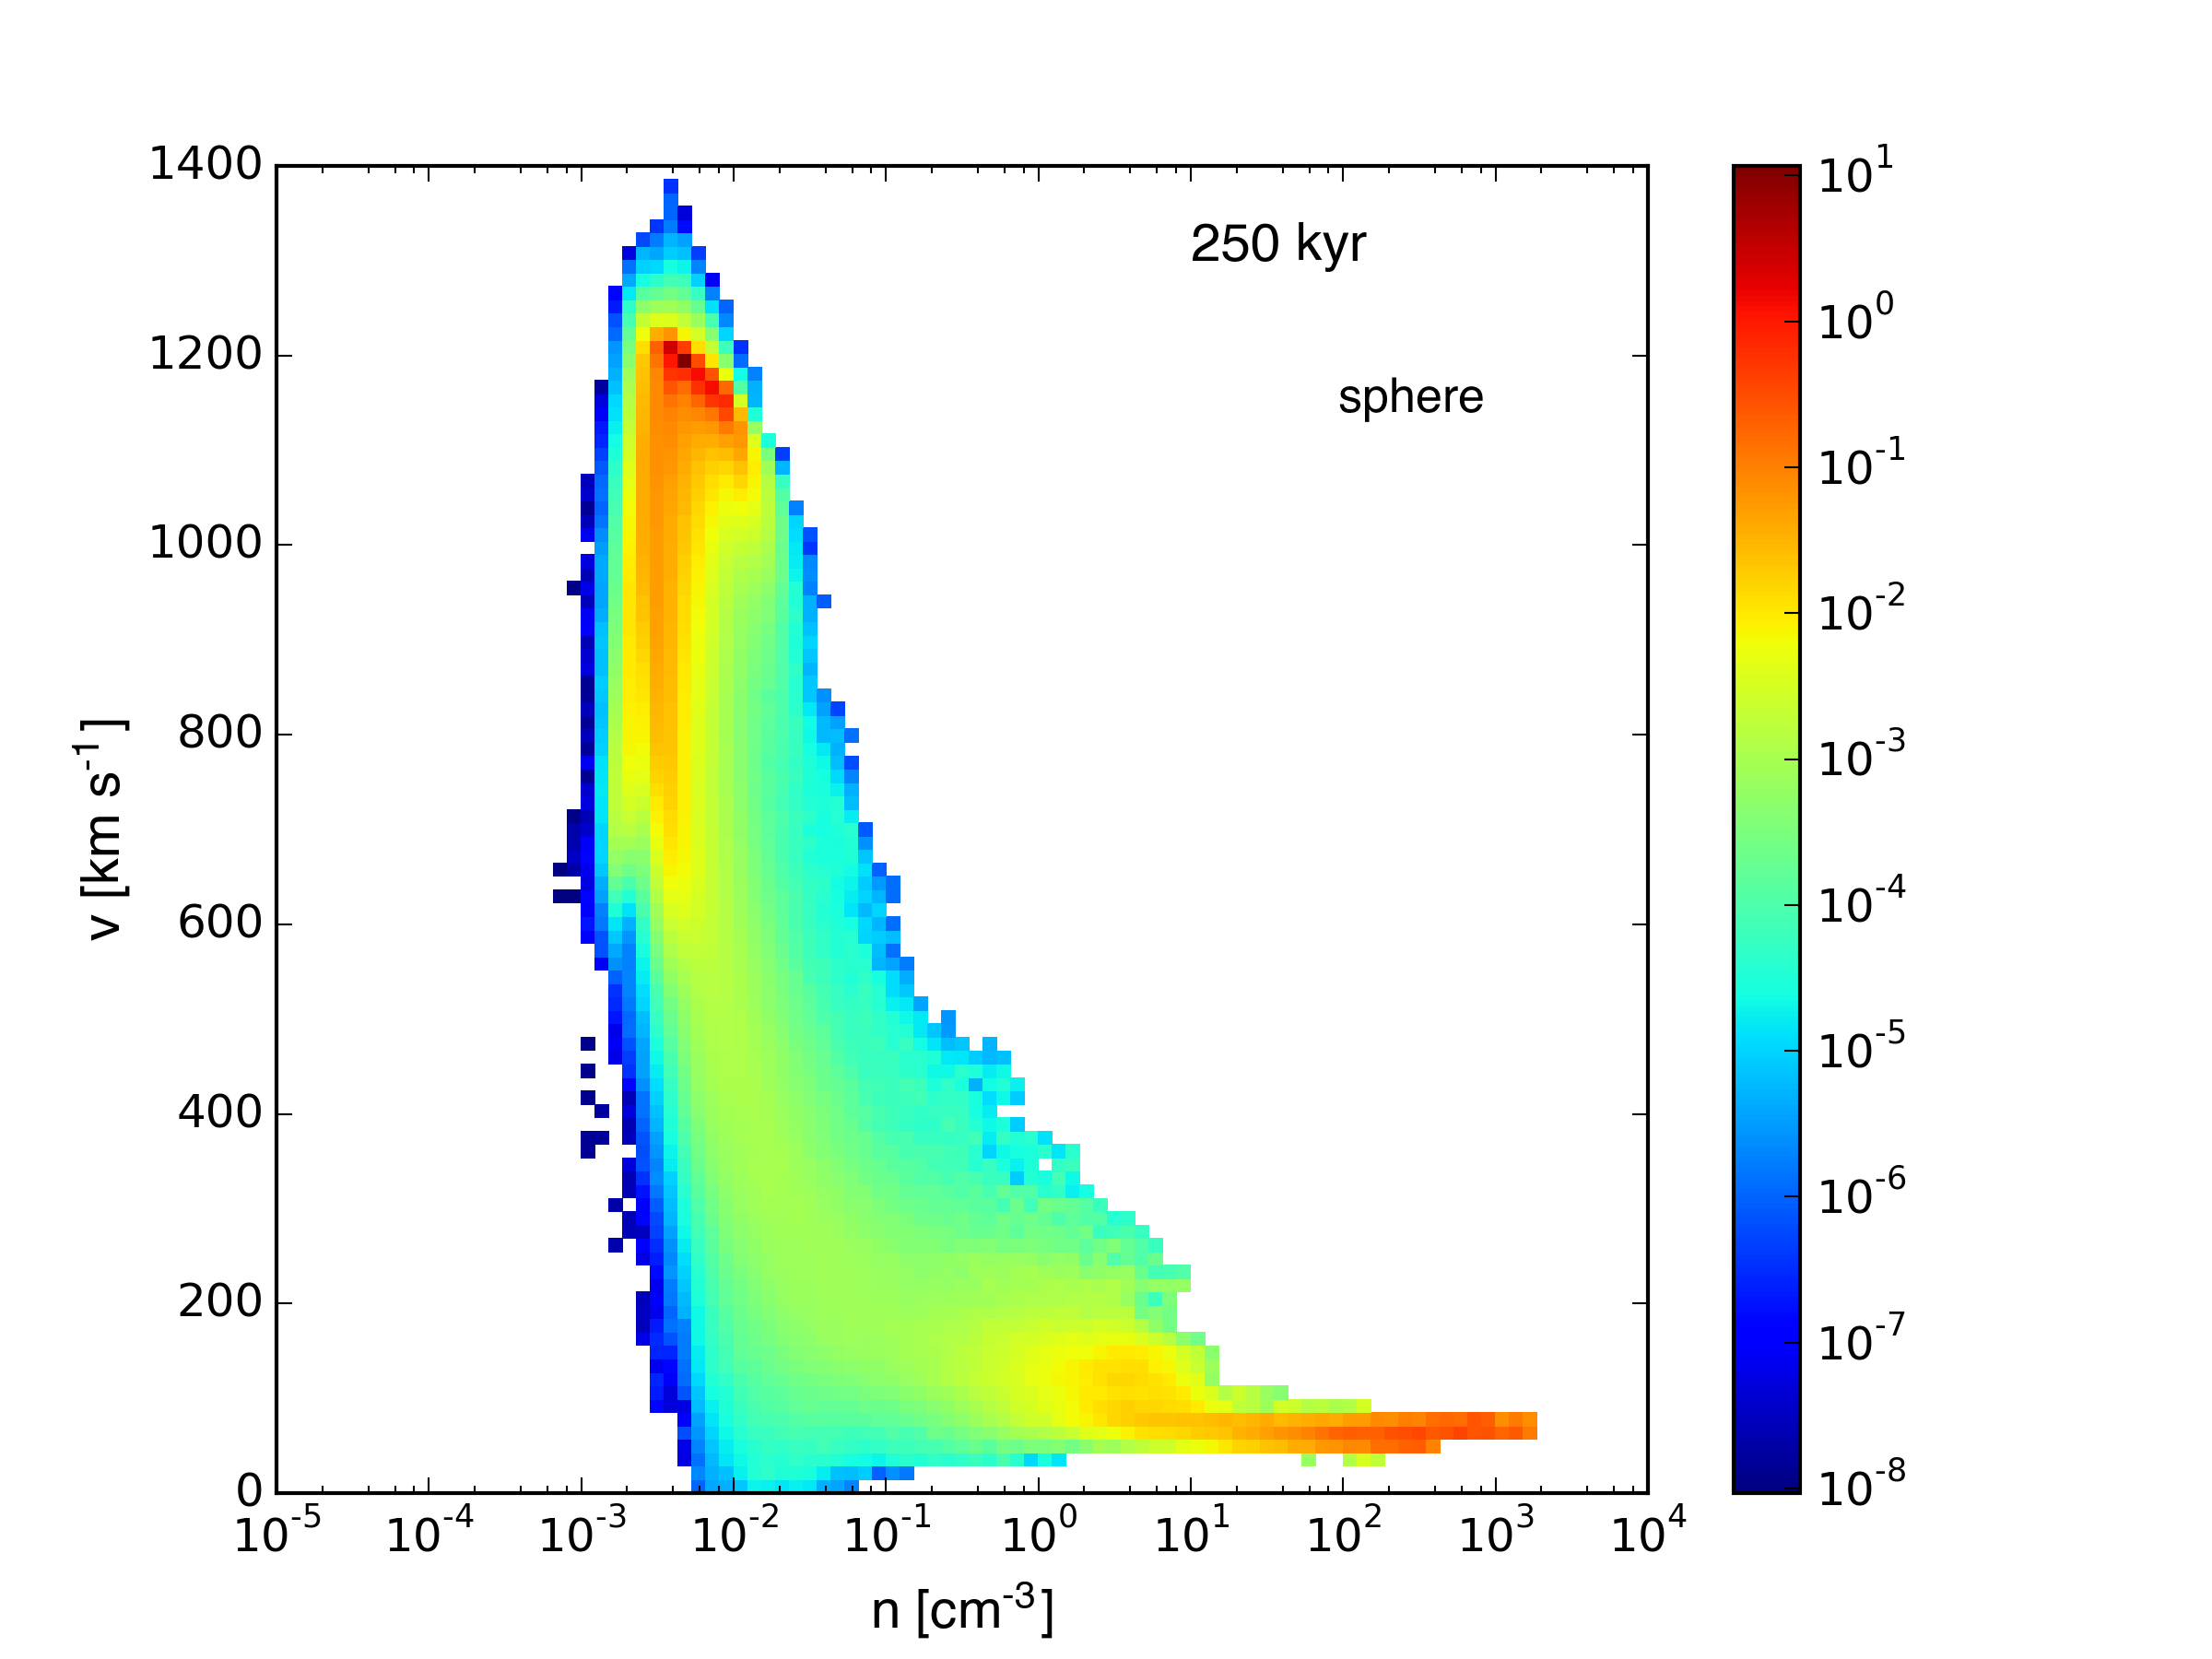
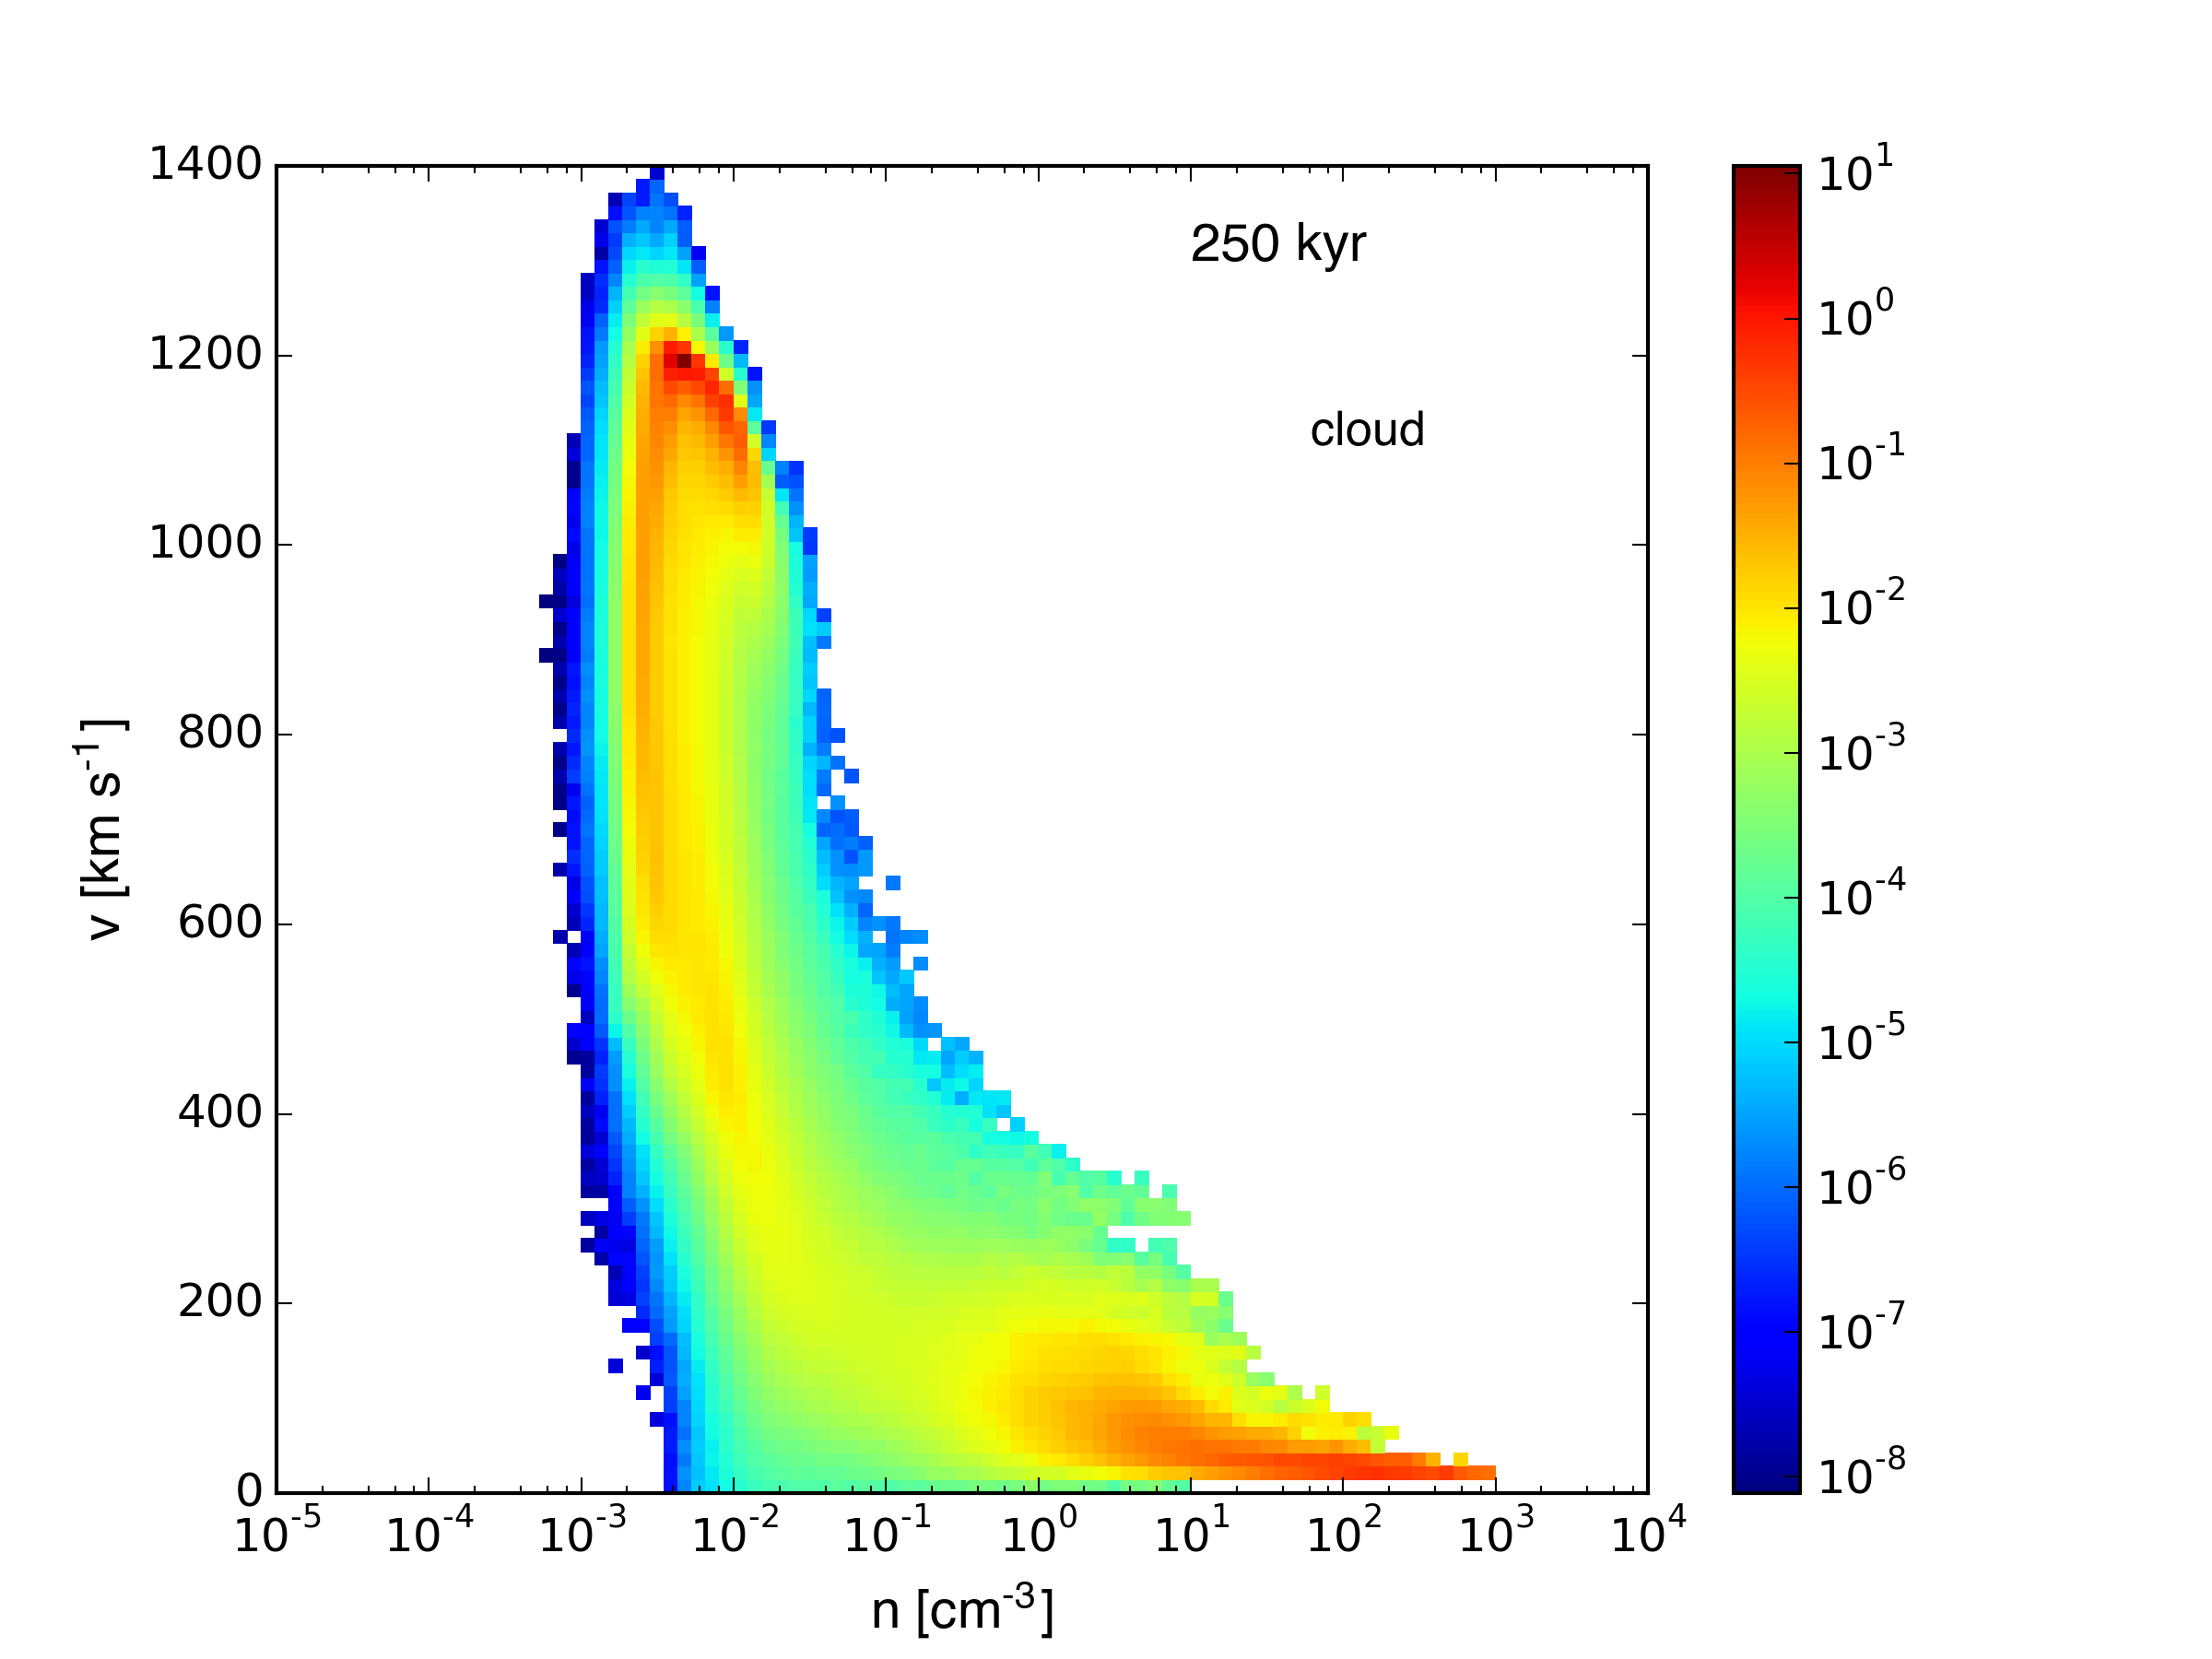
The first thing that was obvious to me is the fact that gas at a given density threshold tends to be moving faster in the sphere simulation, indicating that momentum has been transferred more effectively to the high density gas in the spherical cloud. I’m not exactly sure why this is. After the shock has passed through the cloud, the maximum column densities are actually higher in the sphere, but the original surface density (calculated as total mass in the cloud divided by the diameter) is larger for the turbulent cloud.
It seems perhaps a lot of the wind momentum in the cloud case is initially transferred to lower density material, which is quickly carried off the grid. The difference in the momentum column densities is clearly apparent in the x-axis projection below.