Resolution Effects (Part 2)
April 4, 2016
The plots below compare the \(n_h = 1\) sphere-wind simulation at two different resolutions. The low-resolution sim had 32 cells / \(R_\mathrm{cloud}\), while the high-resolution sim had 64 cells / \(R_\mathrm{cloud}\). Both simulations were run on a grid with physical size \(160\times40\times40\) pc, but the high resolution had \(2048\times512\times512\) cells, so the spatial resolution was 12.8 cells / parsec, vs 6.4 cells / parsec for the low resolution run. Both simulations use the new initial cloud density profile, which tapers exponentially to the wind density floor, starting at a cloud radius of 4.5 pc. The center of the cloud has a constant density. Both clouds have a mass of \(\approx\) 10 solar masses.
Movies of both simulations are available: low resolution and high resolution.
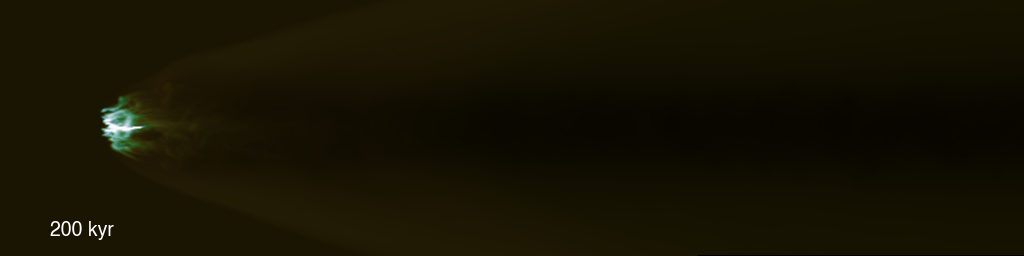
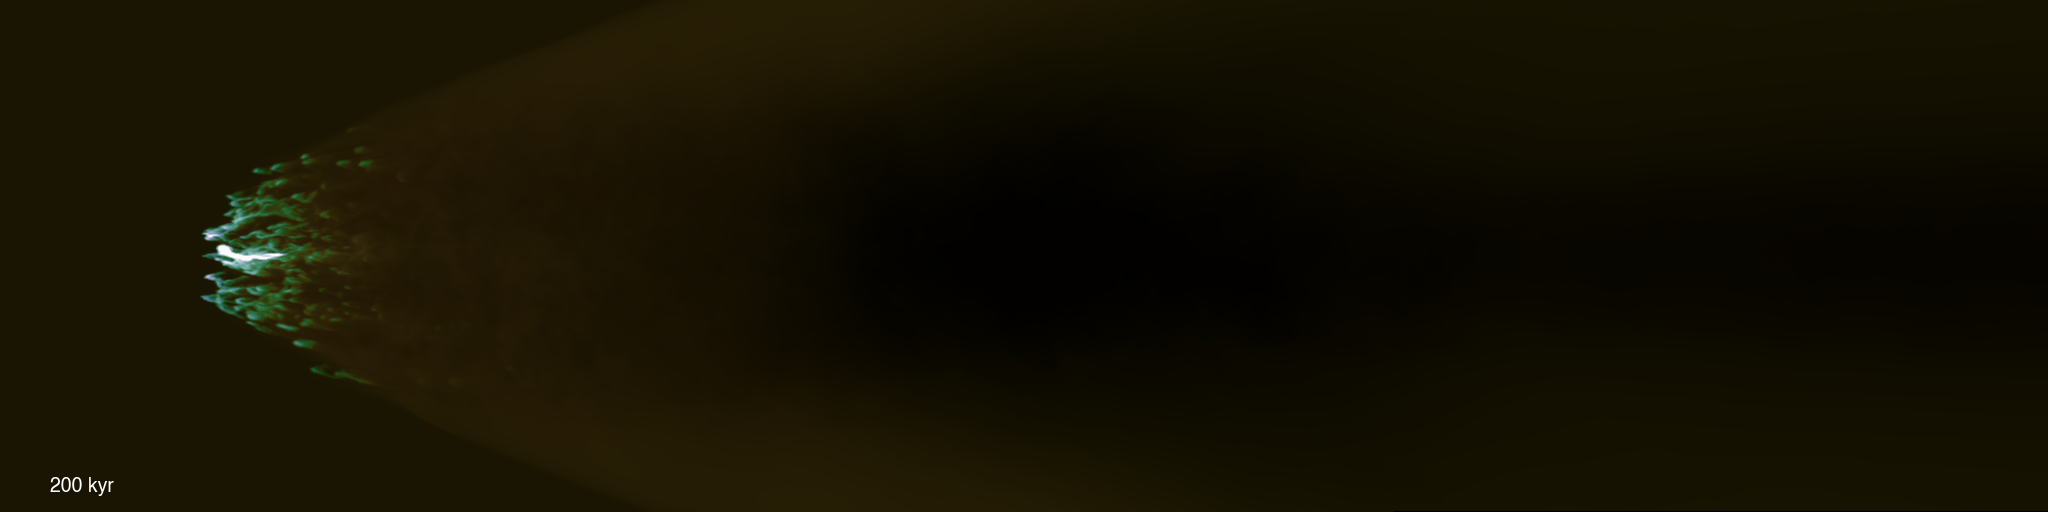
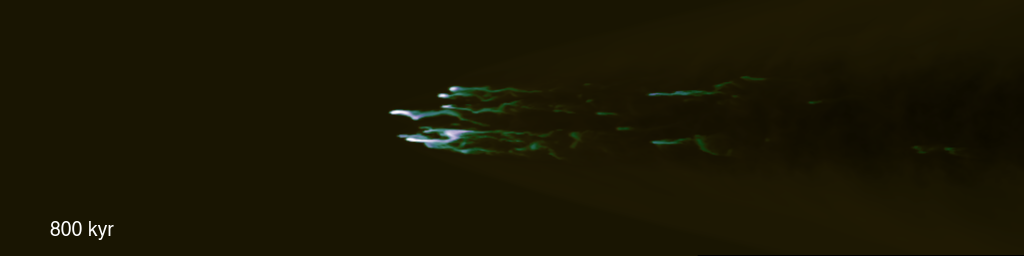
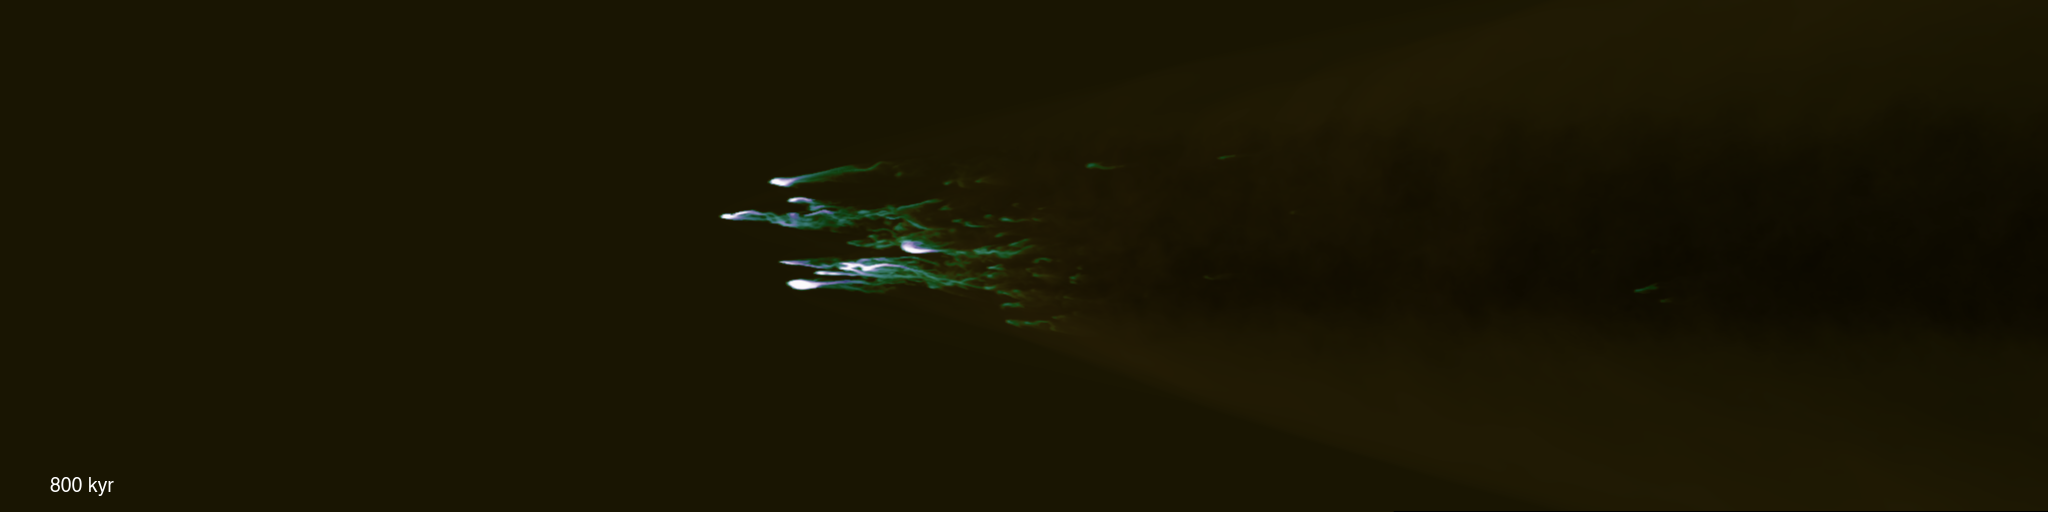
Snapshots of the two clouds at 200, 400, 600, and 800 kyr:
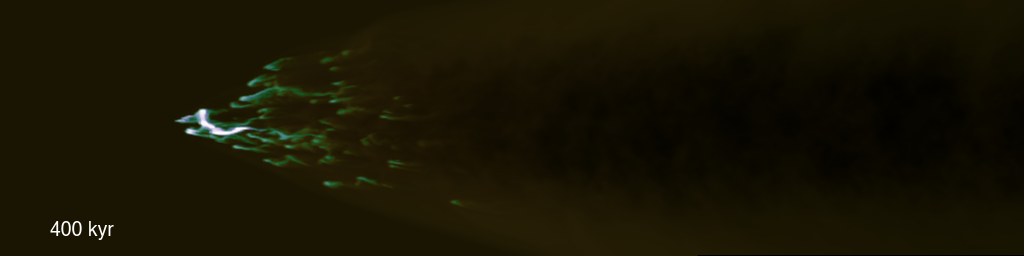
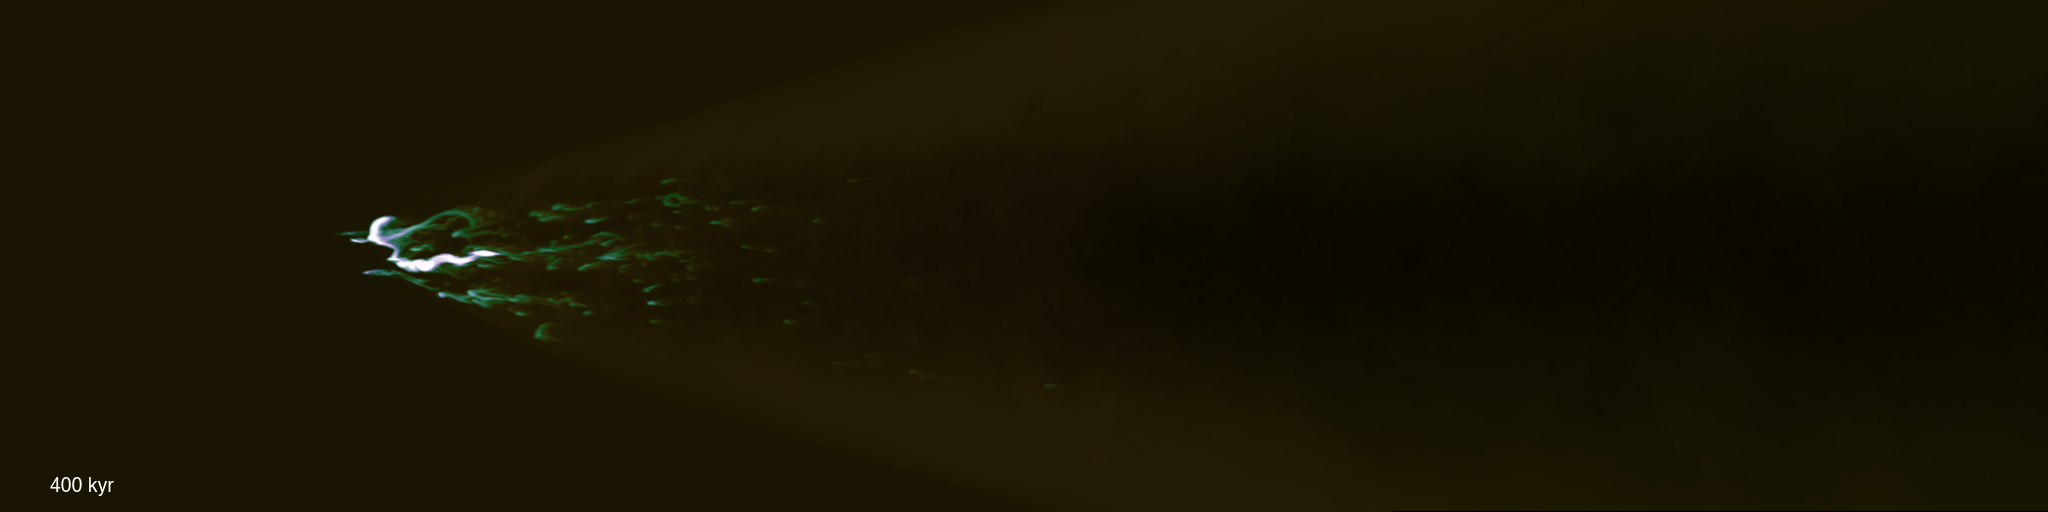
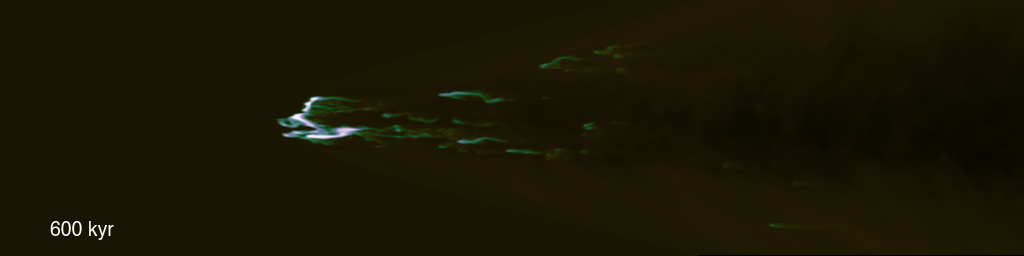
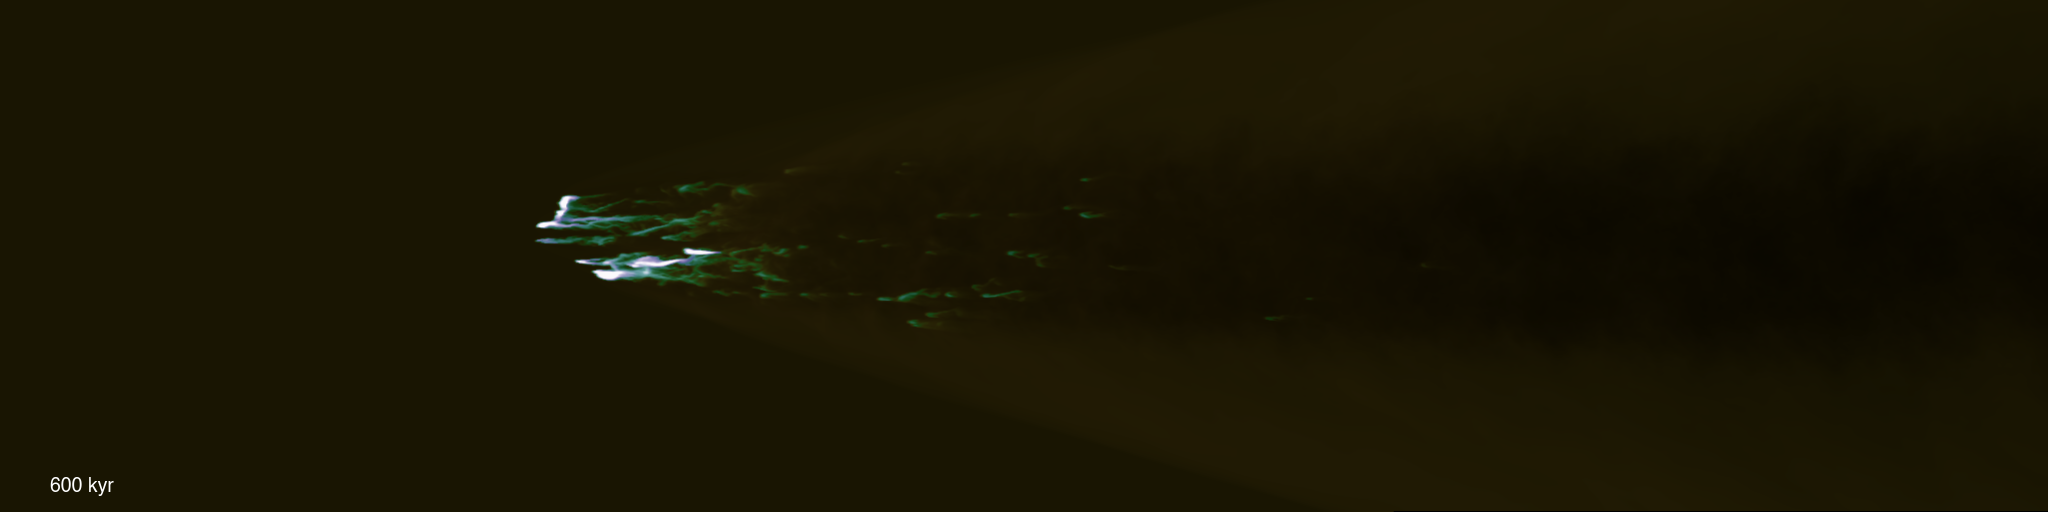
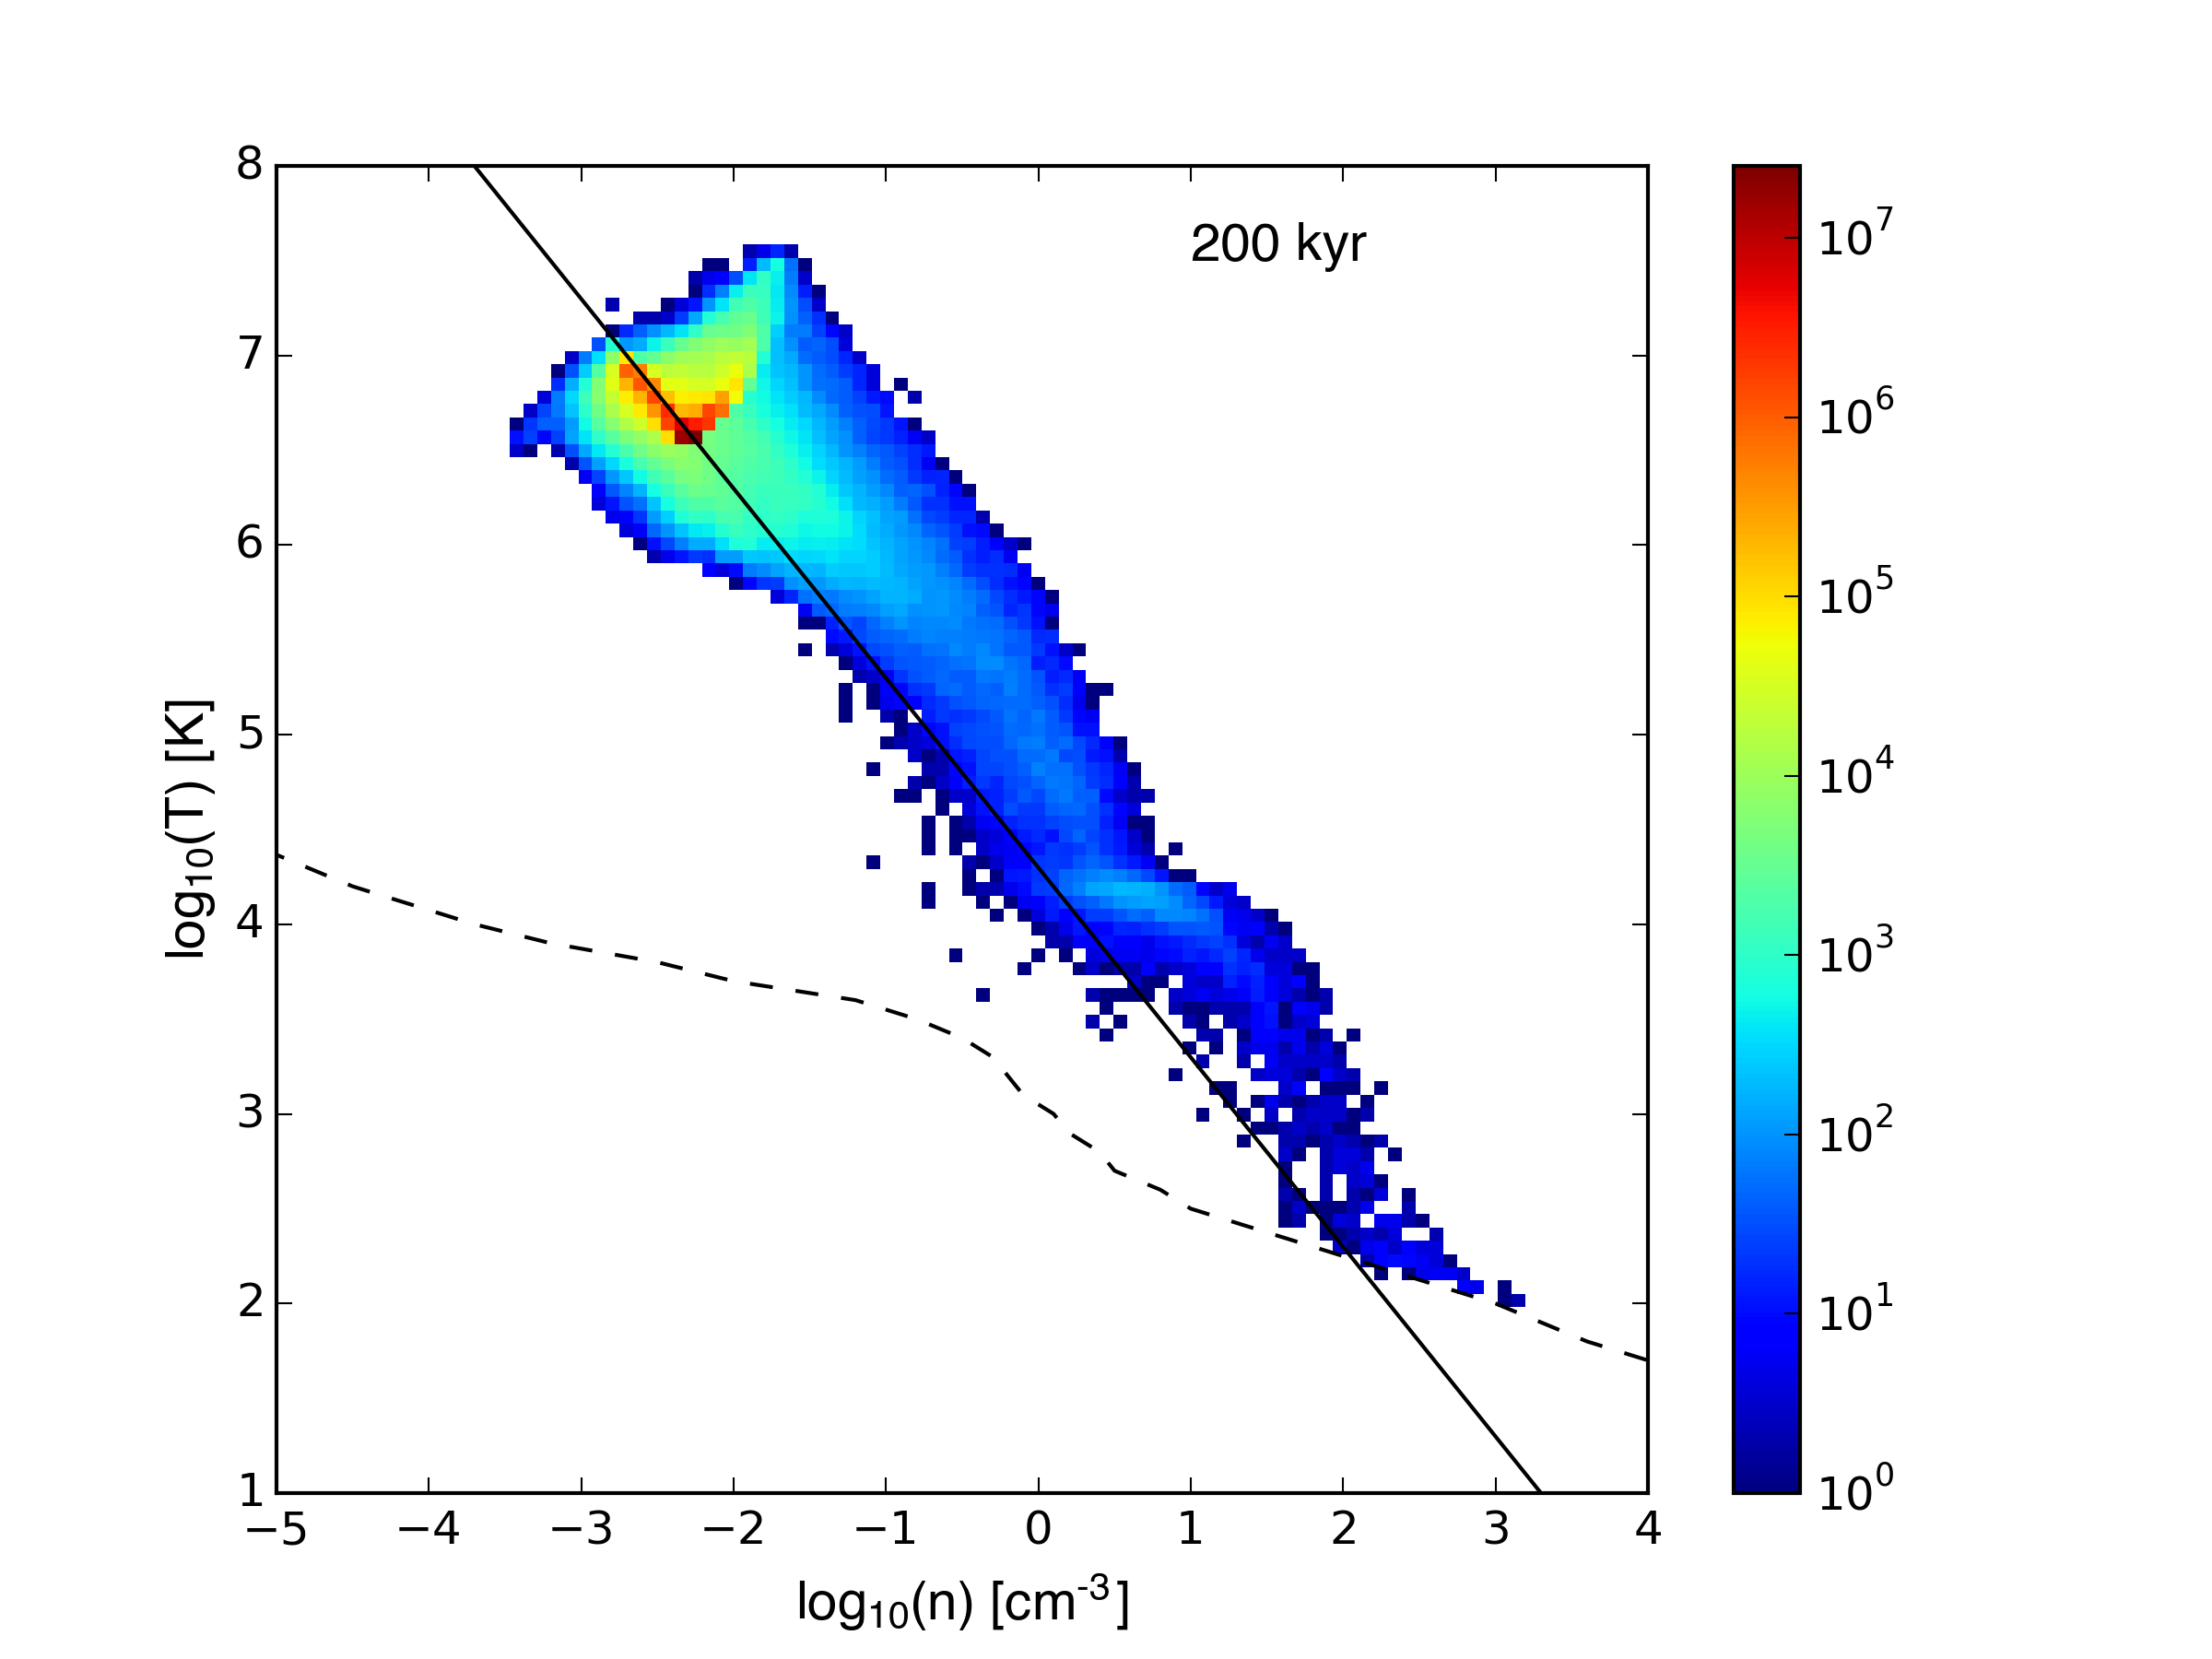
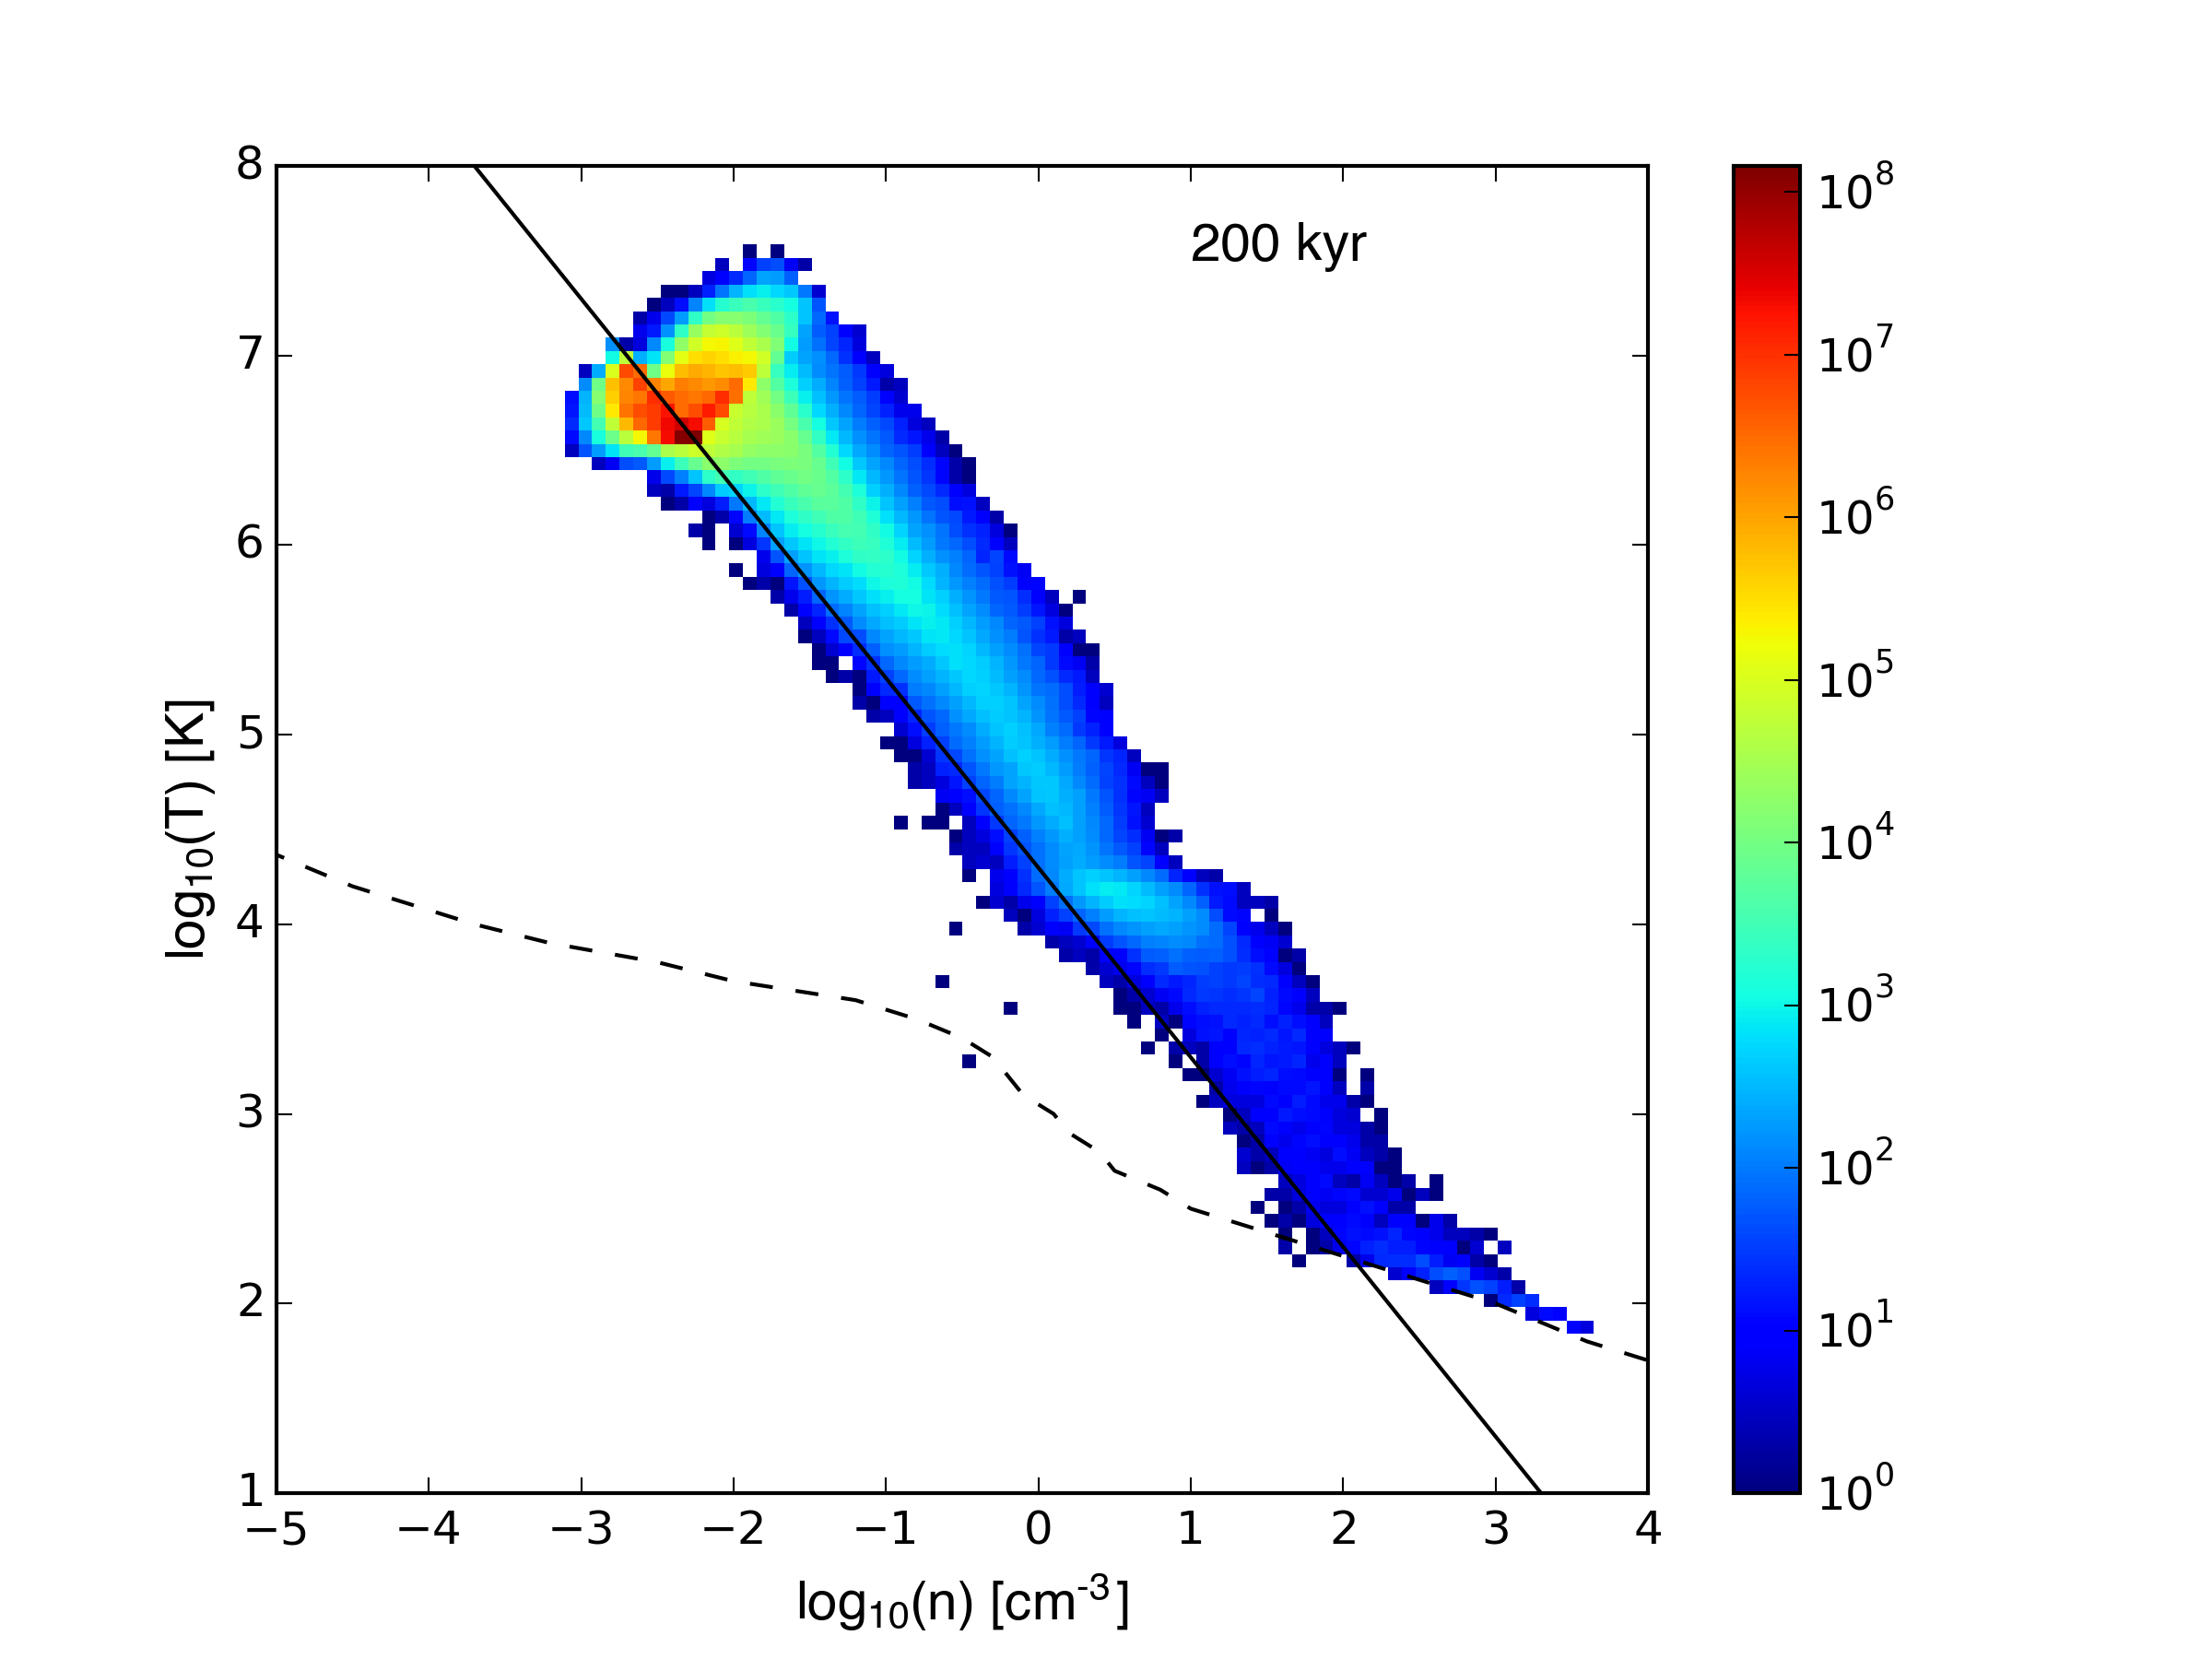
Density-temperature plots (low res followed by high res):
Velocity-weighted density-temperature plots:
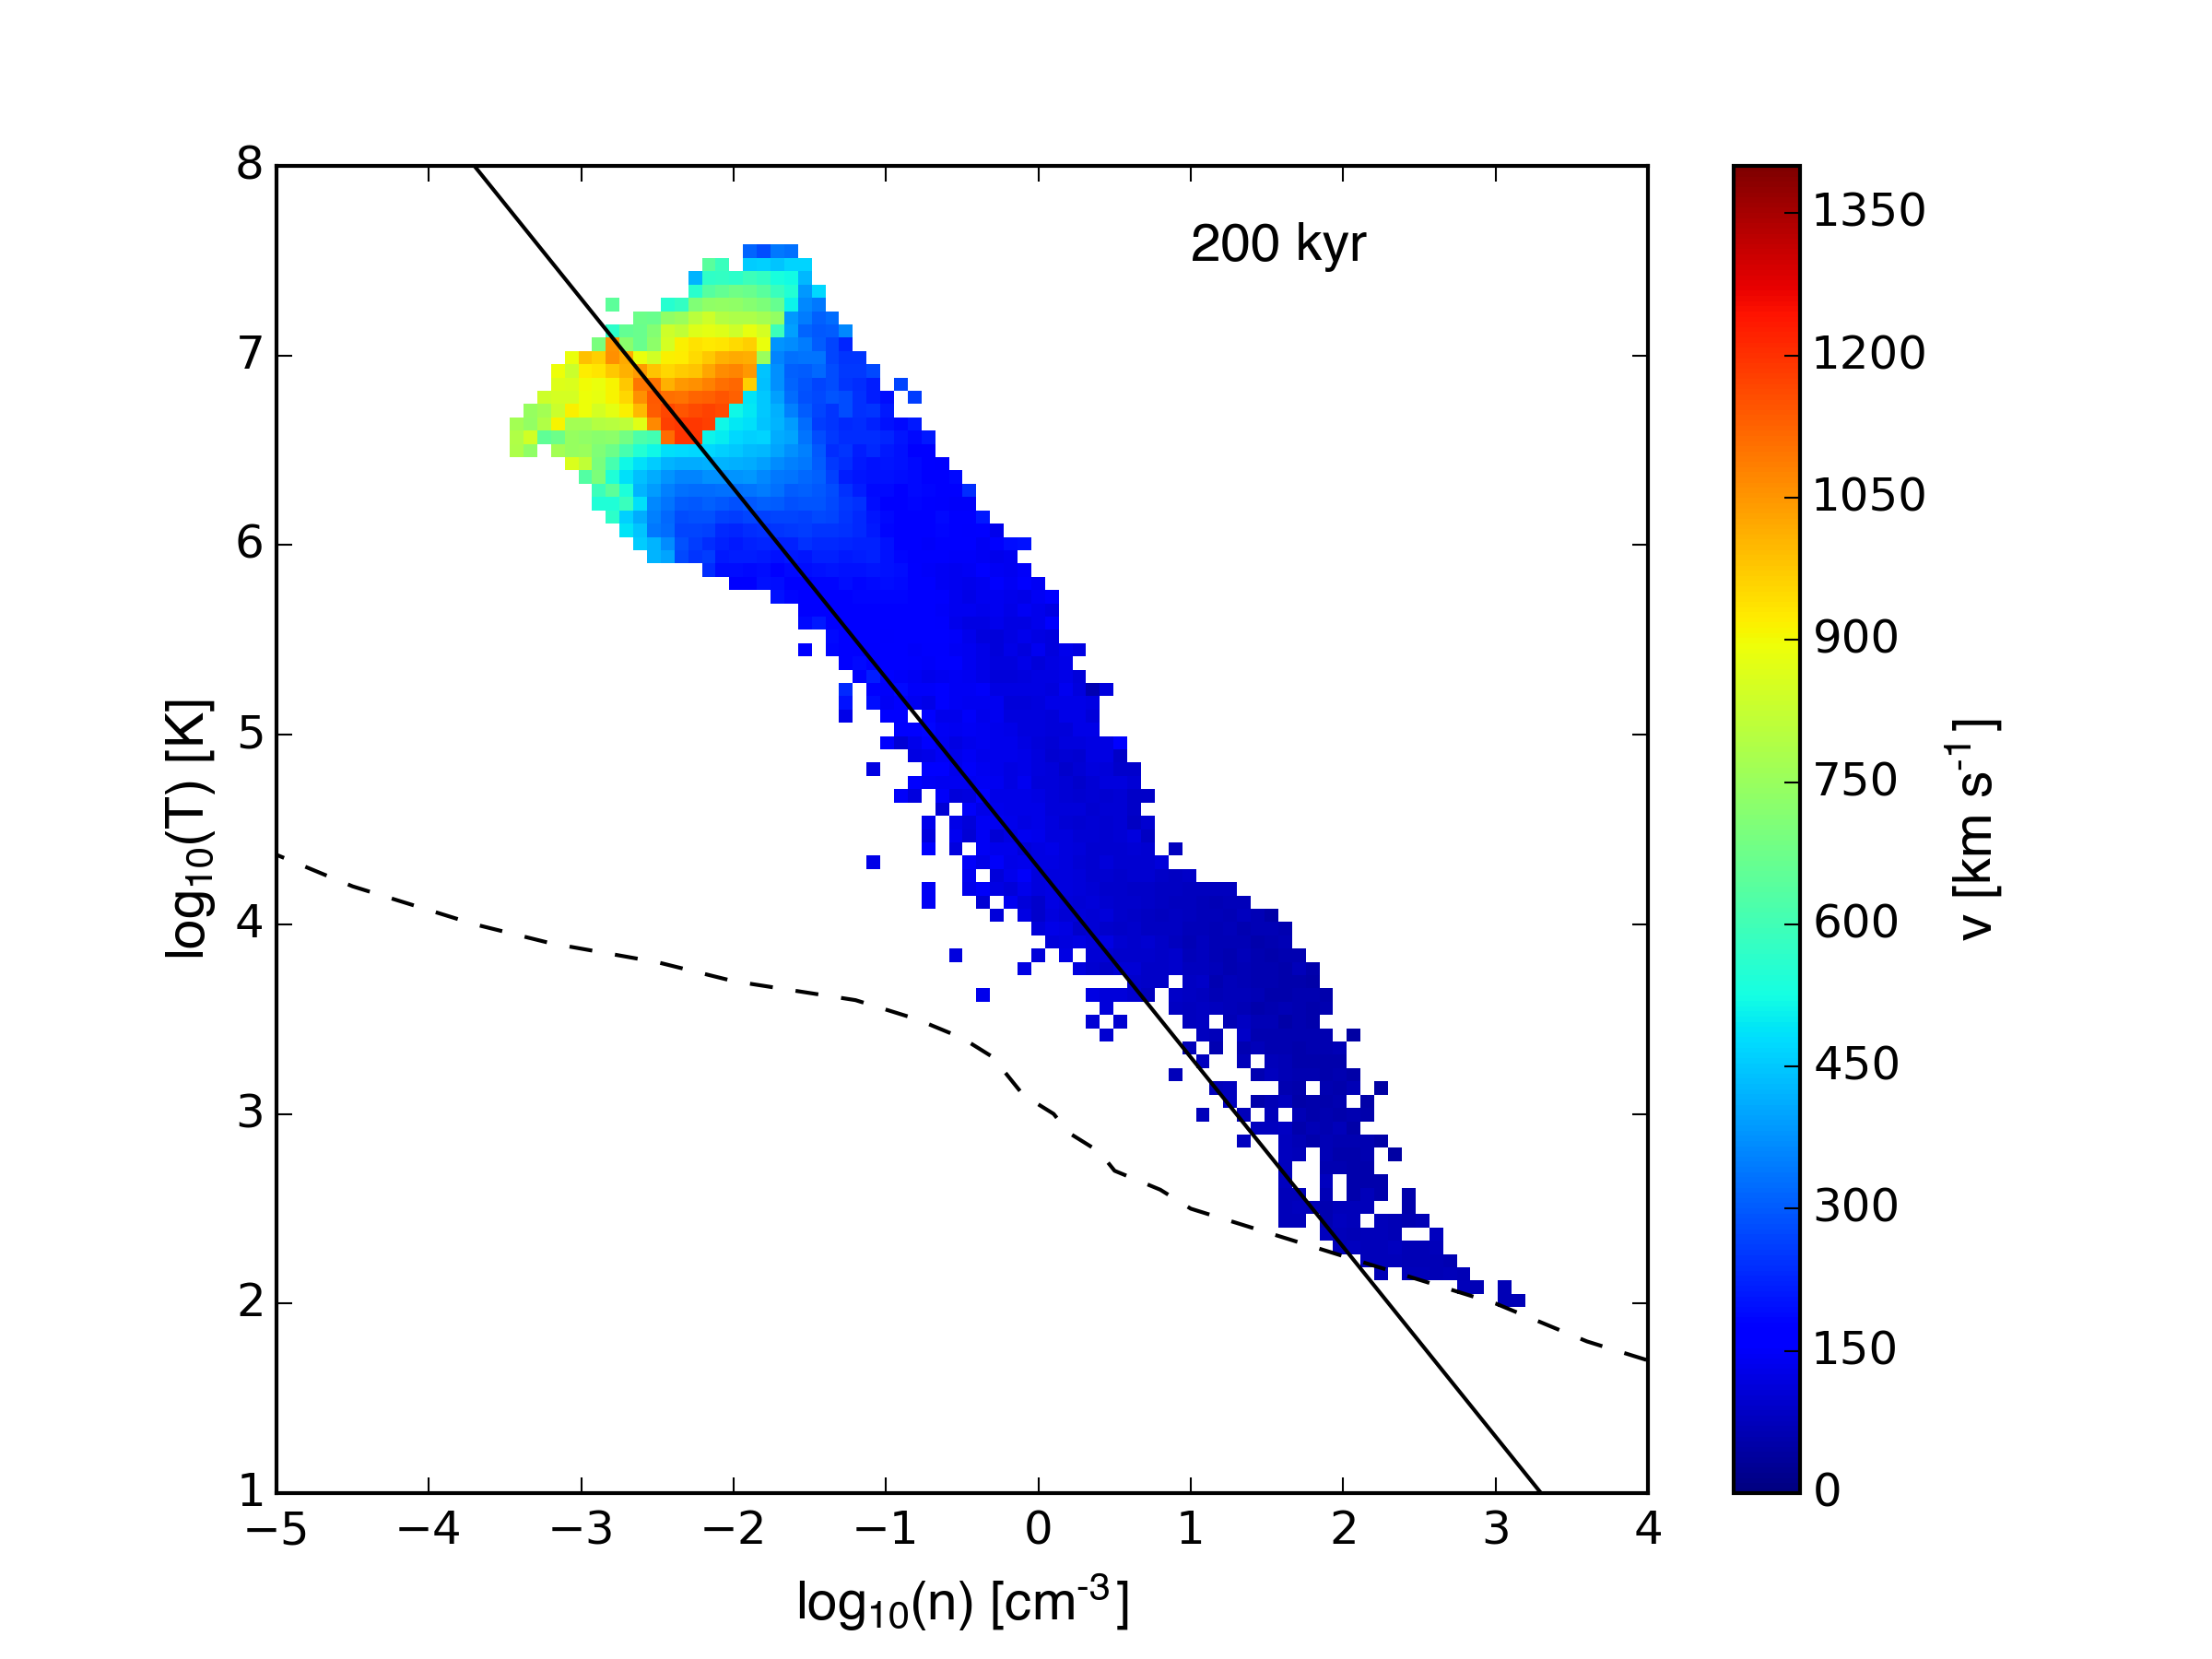
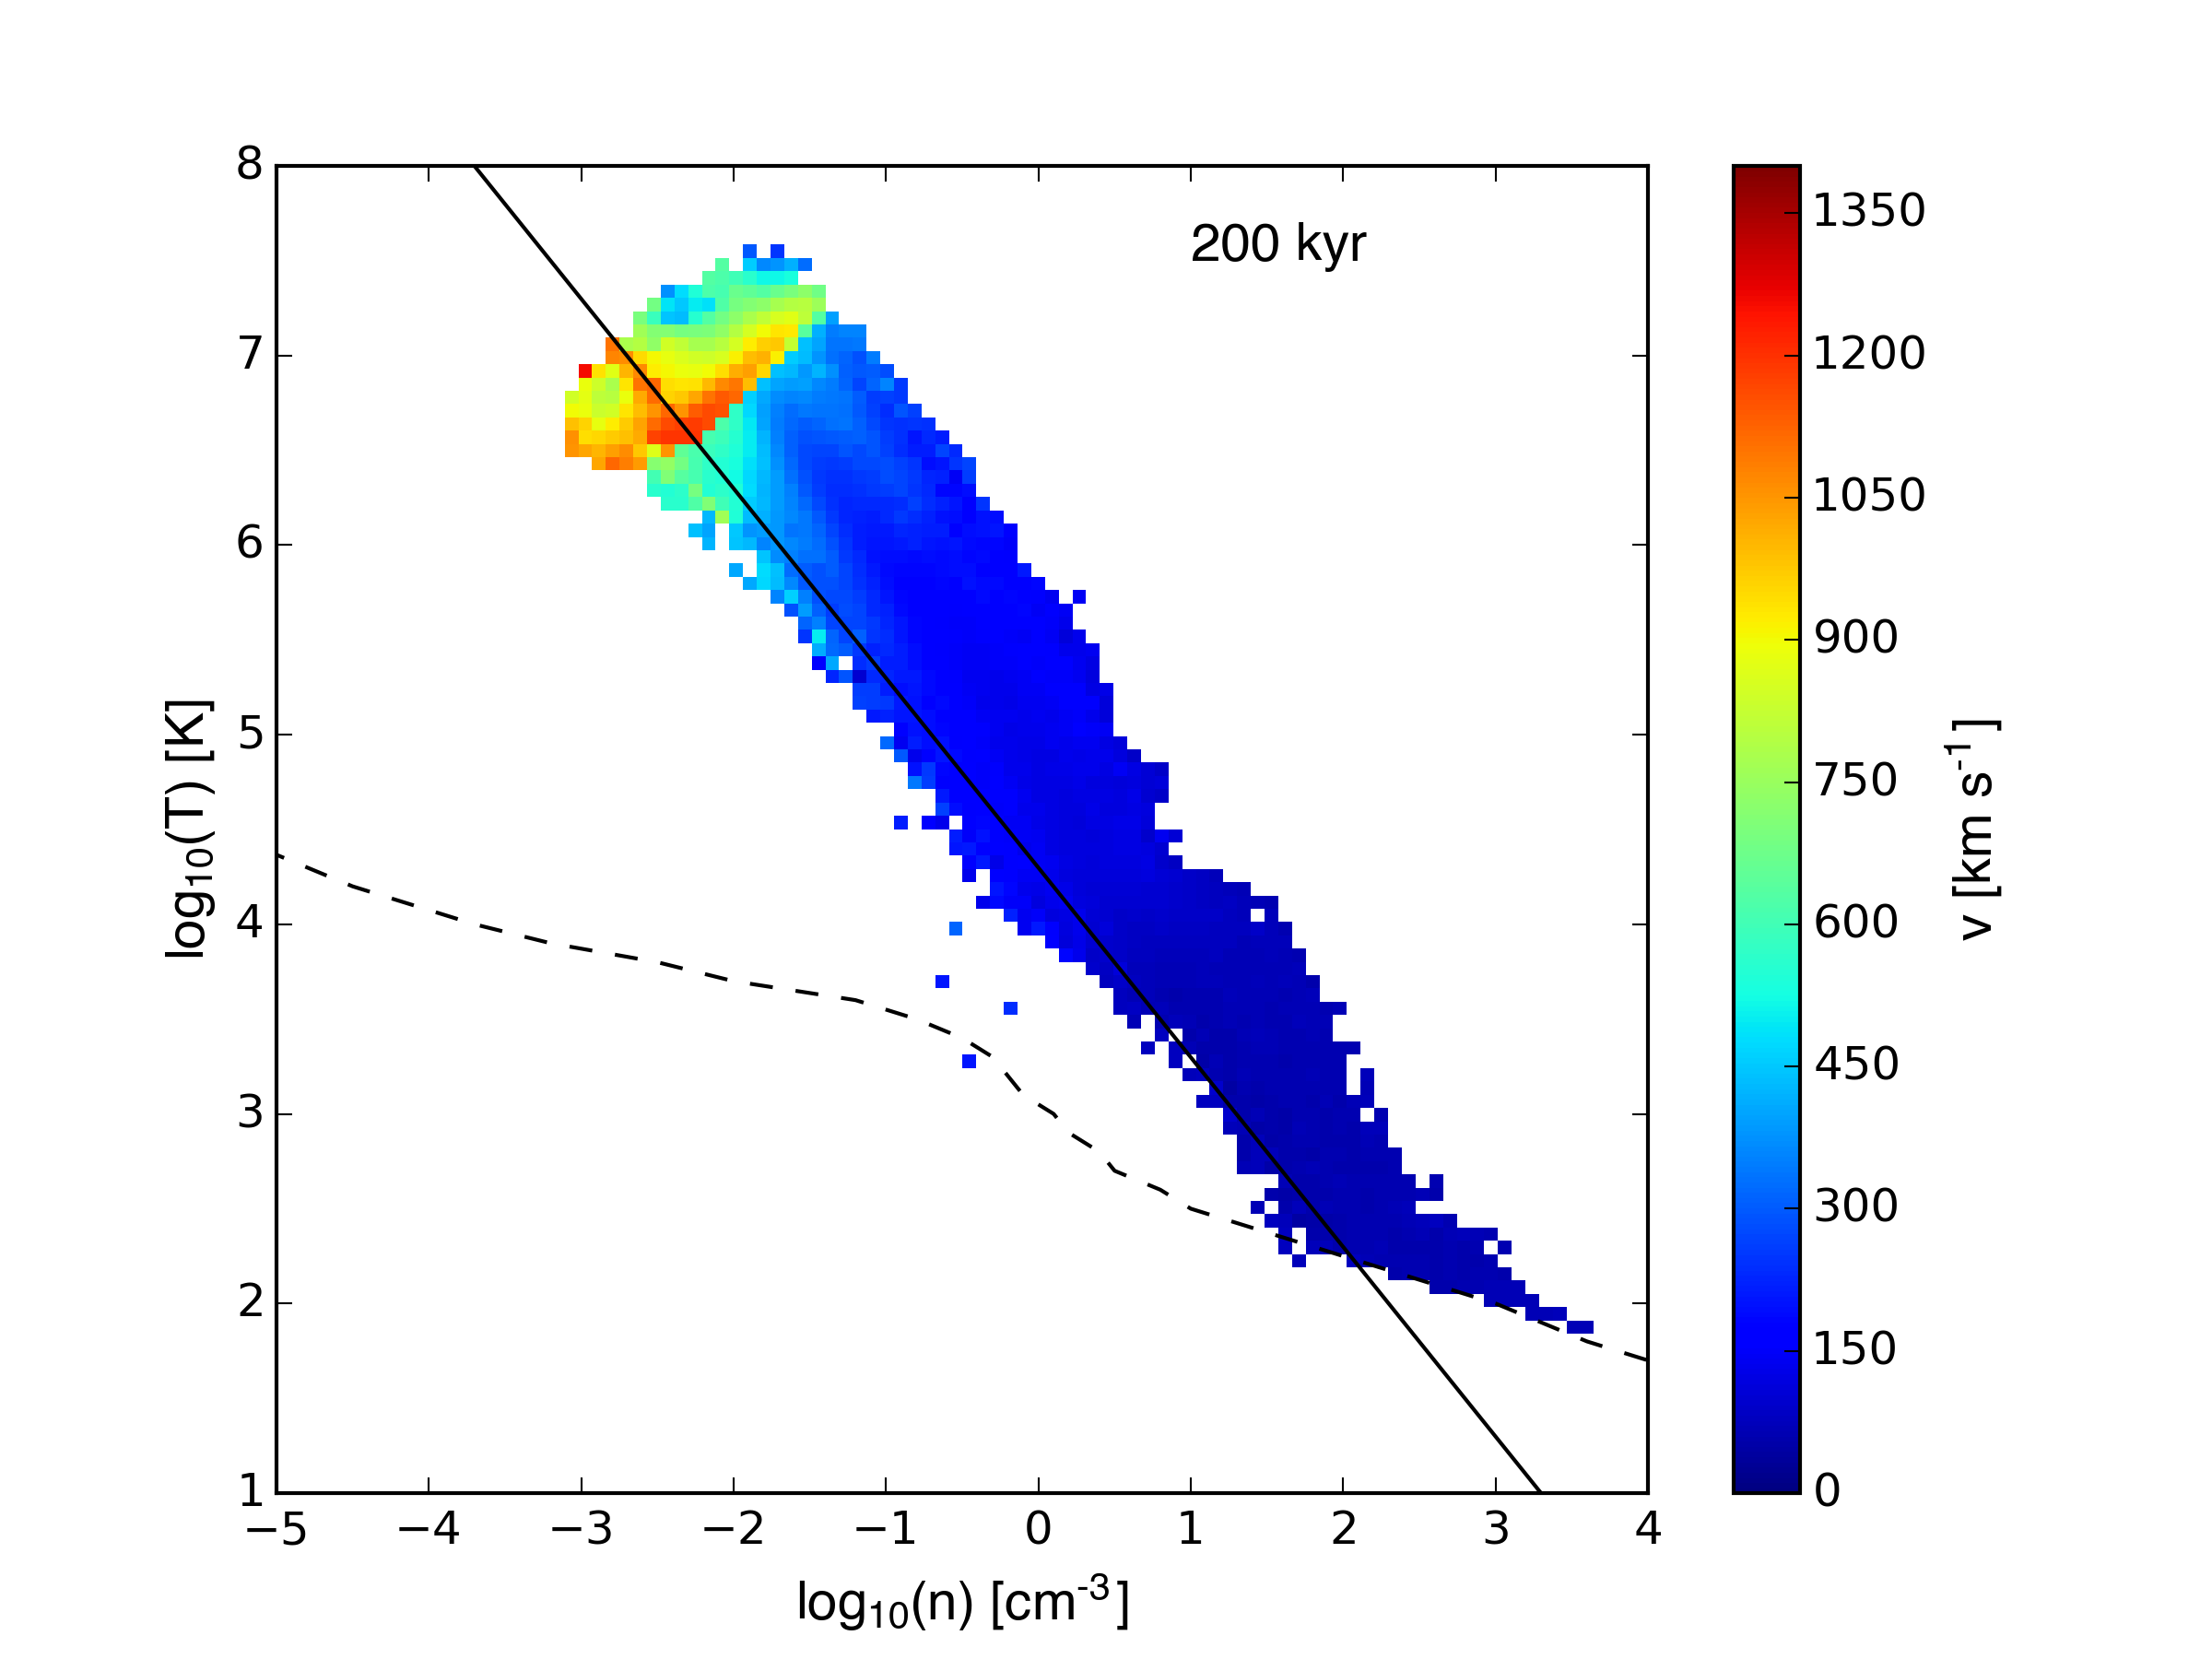
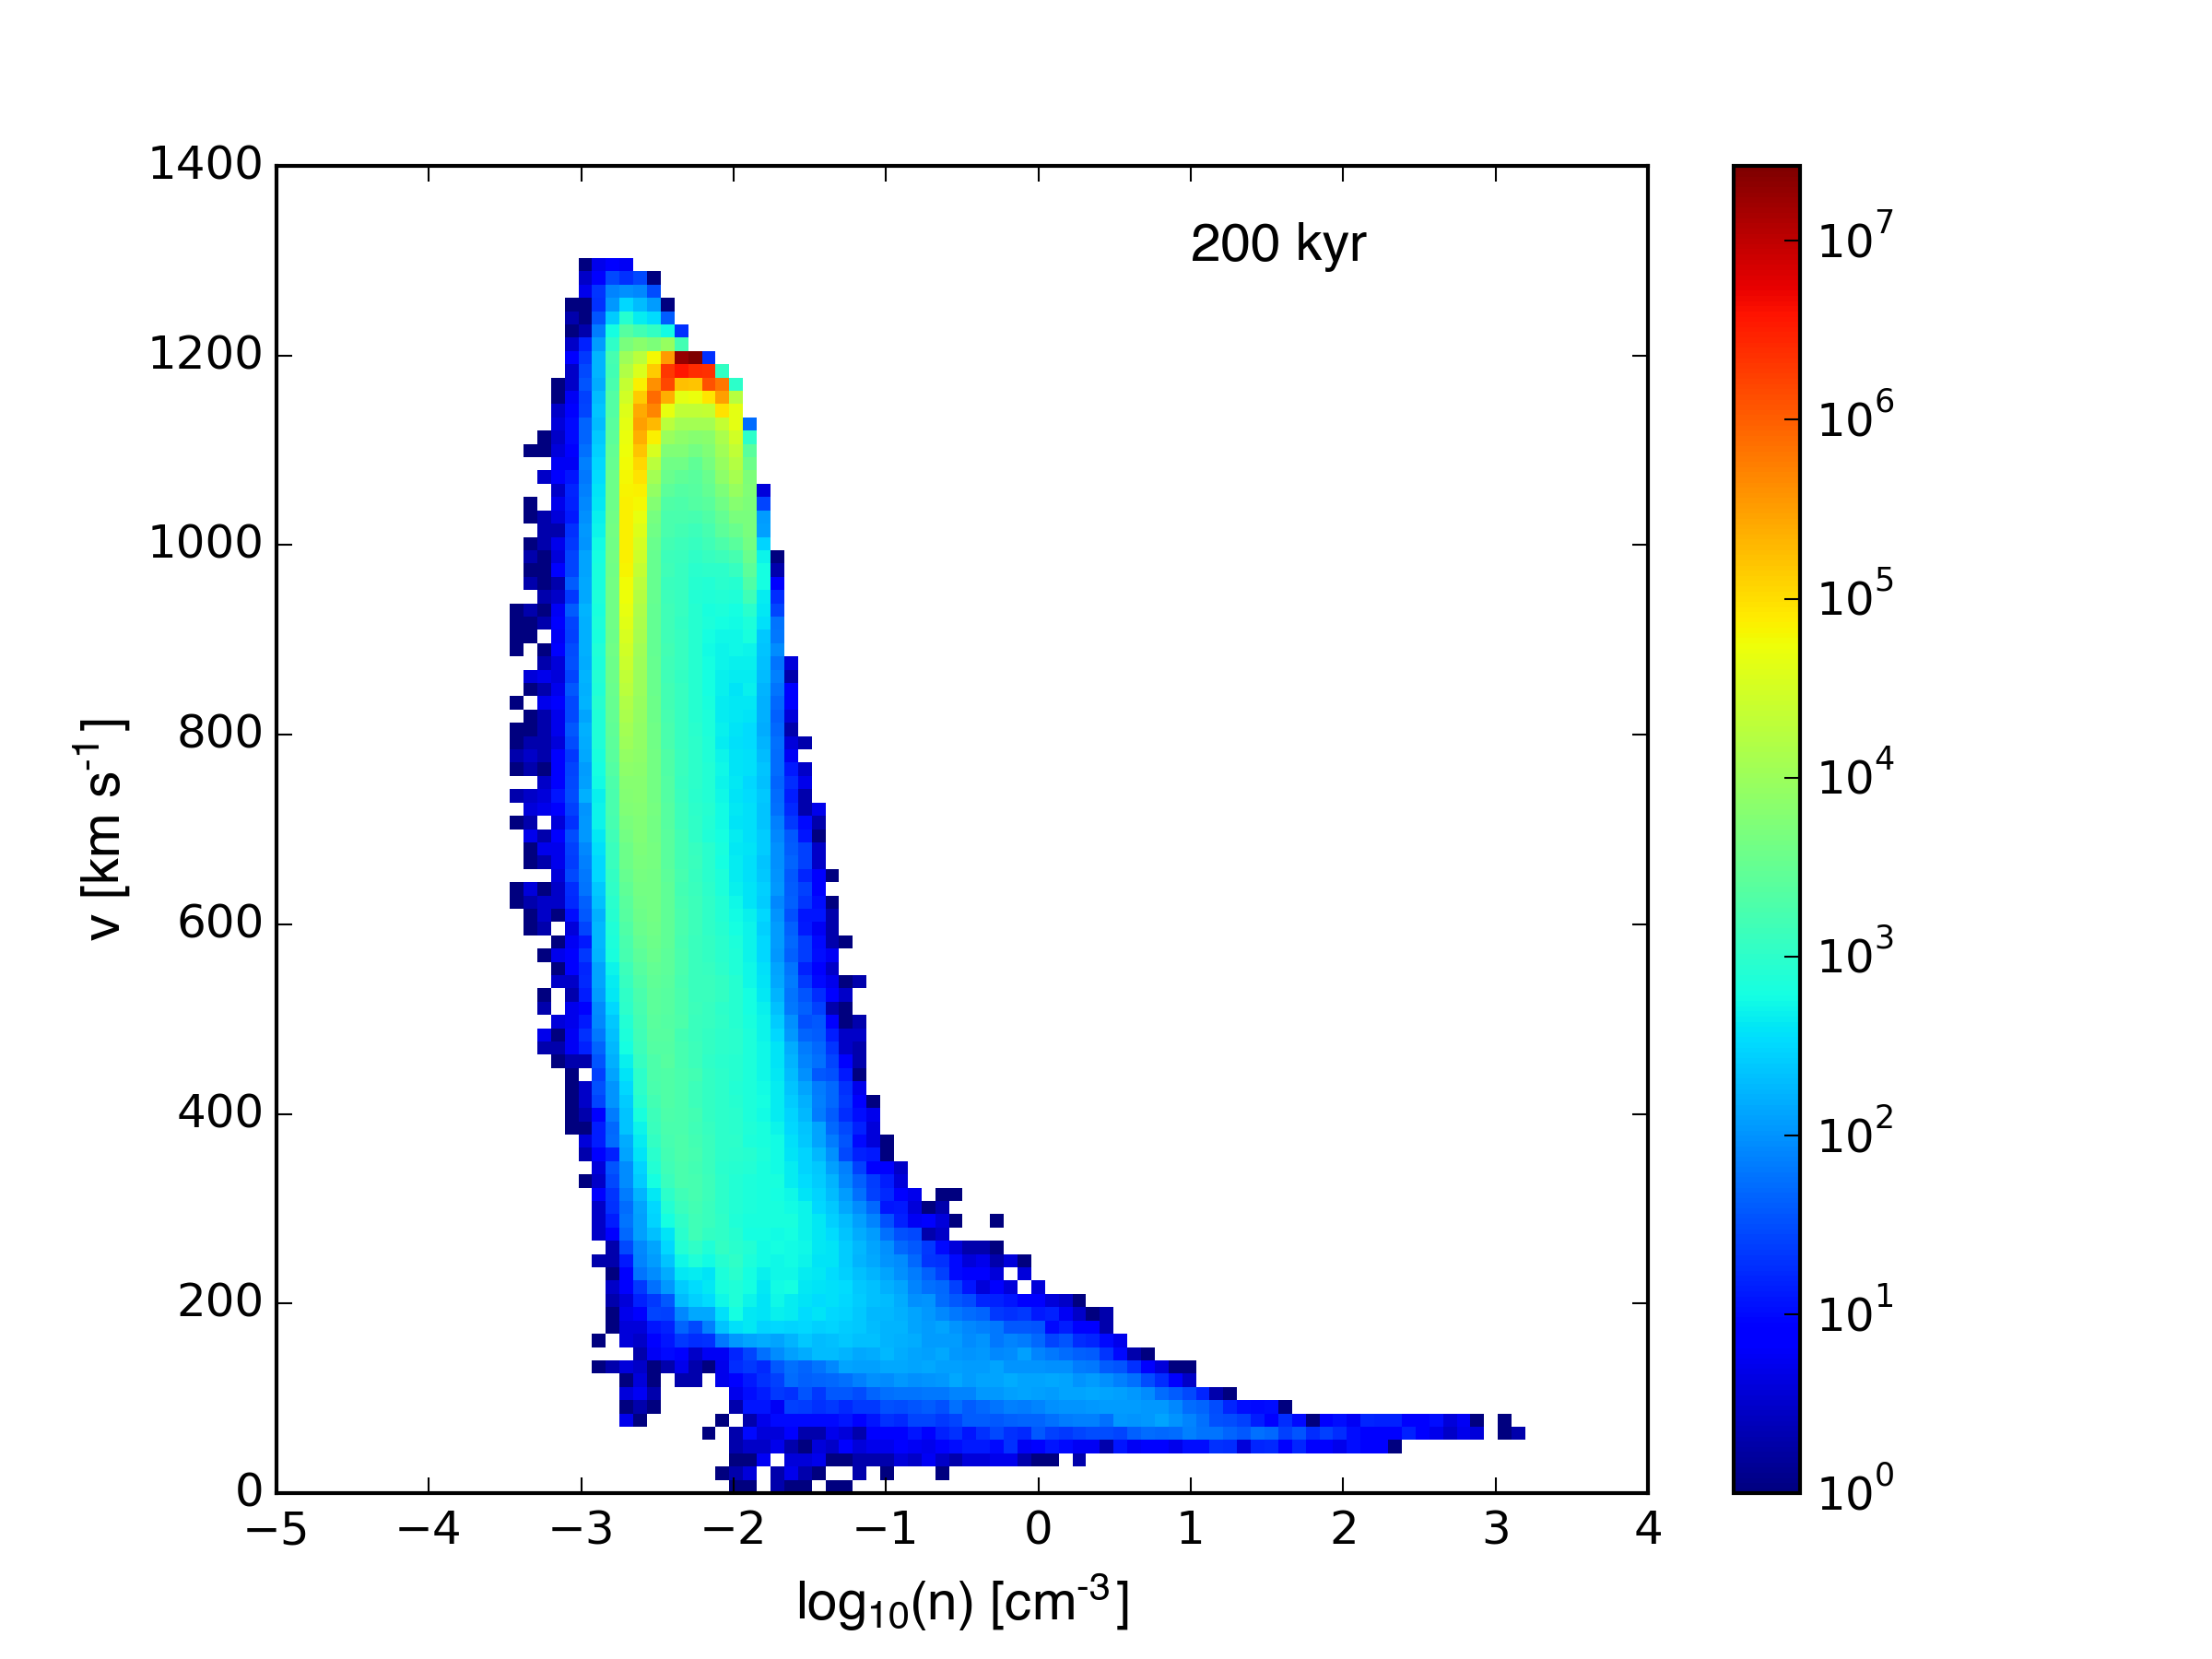
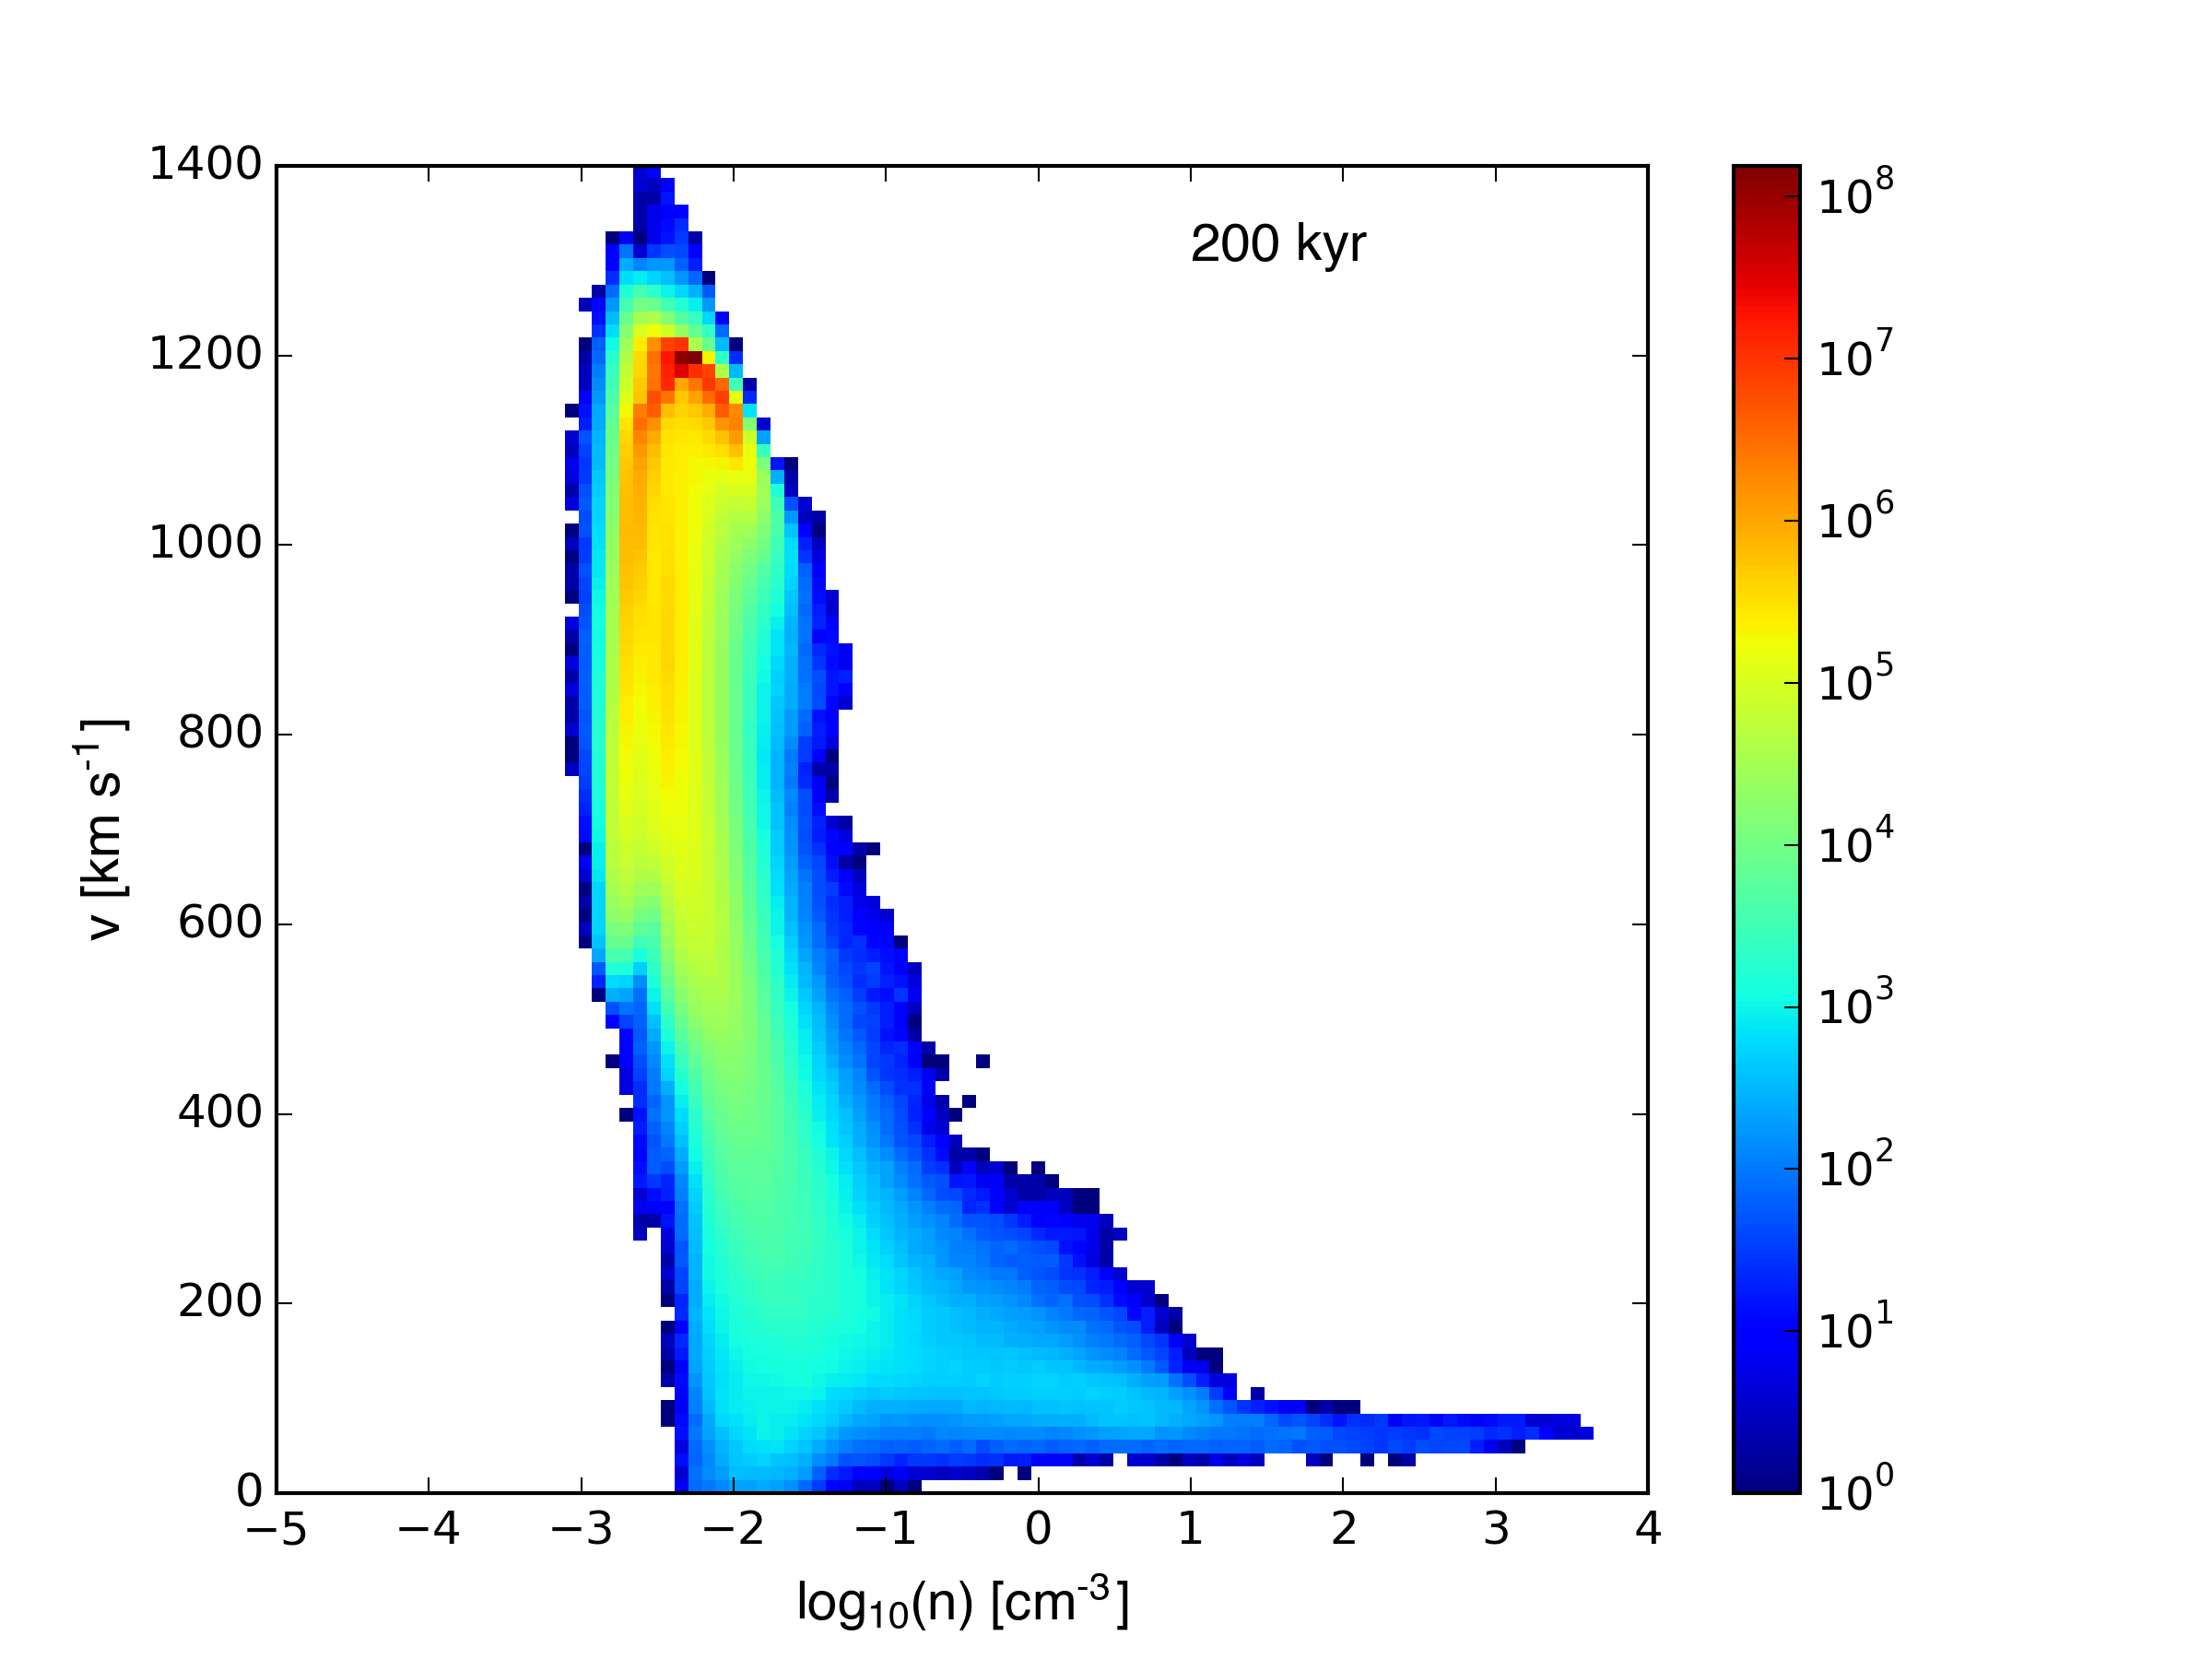
Density-velocity plots: