Resolution Effects
March 24, 2016
The plots below compare the \(n_h = 1\) sphere-wind simulation at two different resolutions. The low-resolution sim had 32 cells / \(R_\mathrm{cloud}\), while the high-resolution sim had 64 cells / \(R_\mathrm{cloud}\). Both simulations were run on a \(2048\times512\times512\) grid, but the spatial resolution was 6.4 cells / parsec for the low resolution run and 12.8 cells / parsec for the high resolution run. The only other difference between the sims was the initial cloud density profile, which in the low resolution sim gradually tapered to a density \(150\times\) higher than the wind density, and in the high resolution sim steeply tapered to the wind density floor. This resulted in the low resolution cloud having about 20% more mass than the high resolution cloud, ~12 vs ~10 solar masses, respectively.
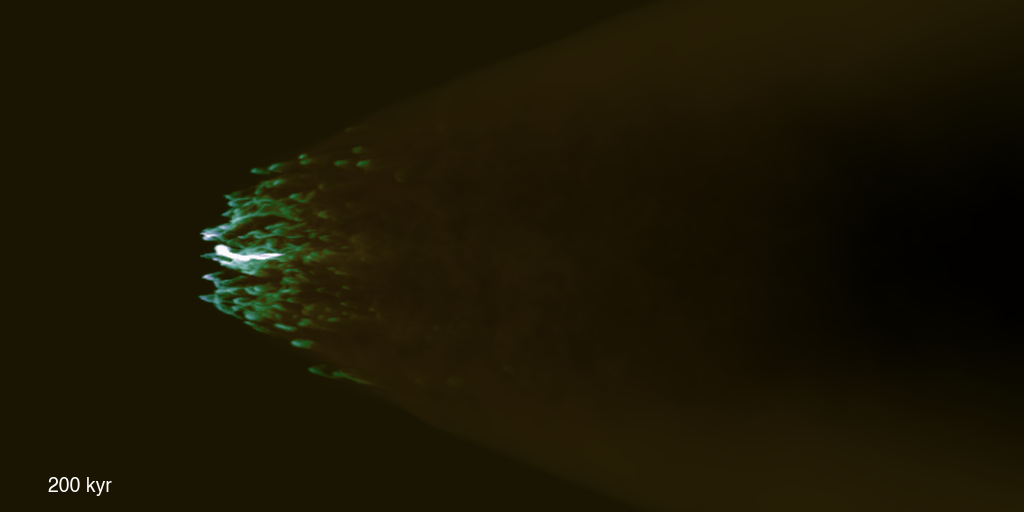
Snapshots of the two clouds at 200 kyr:

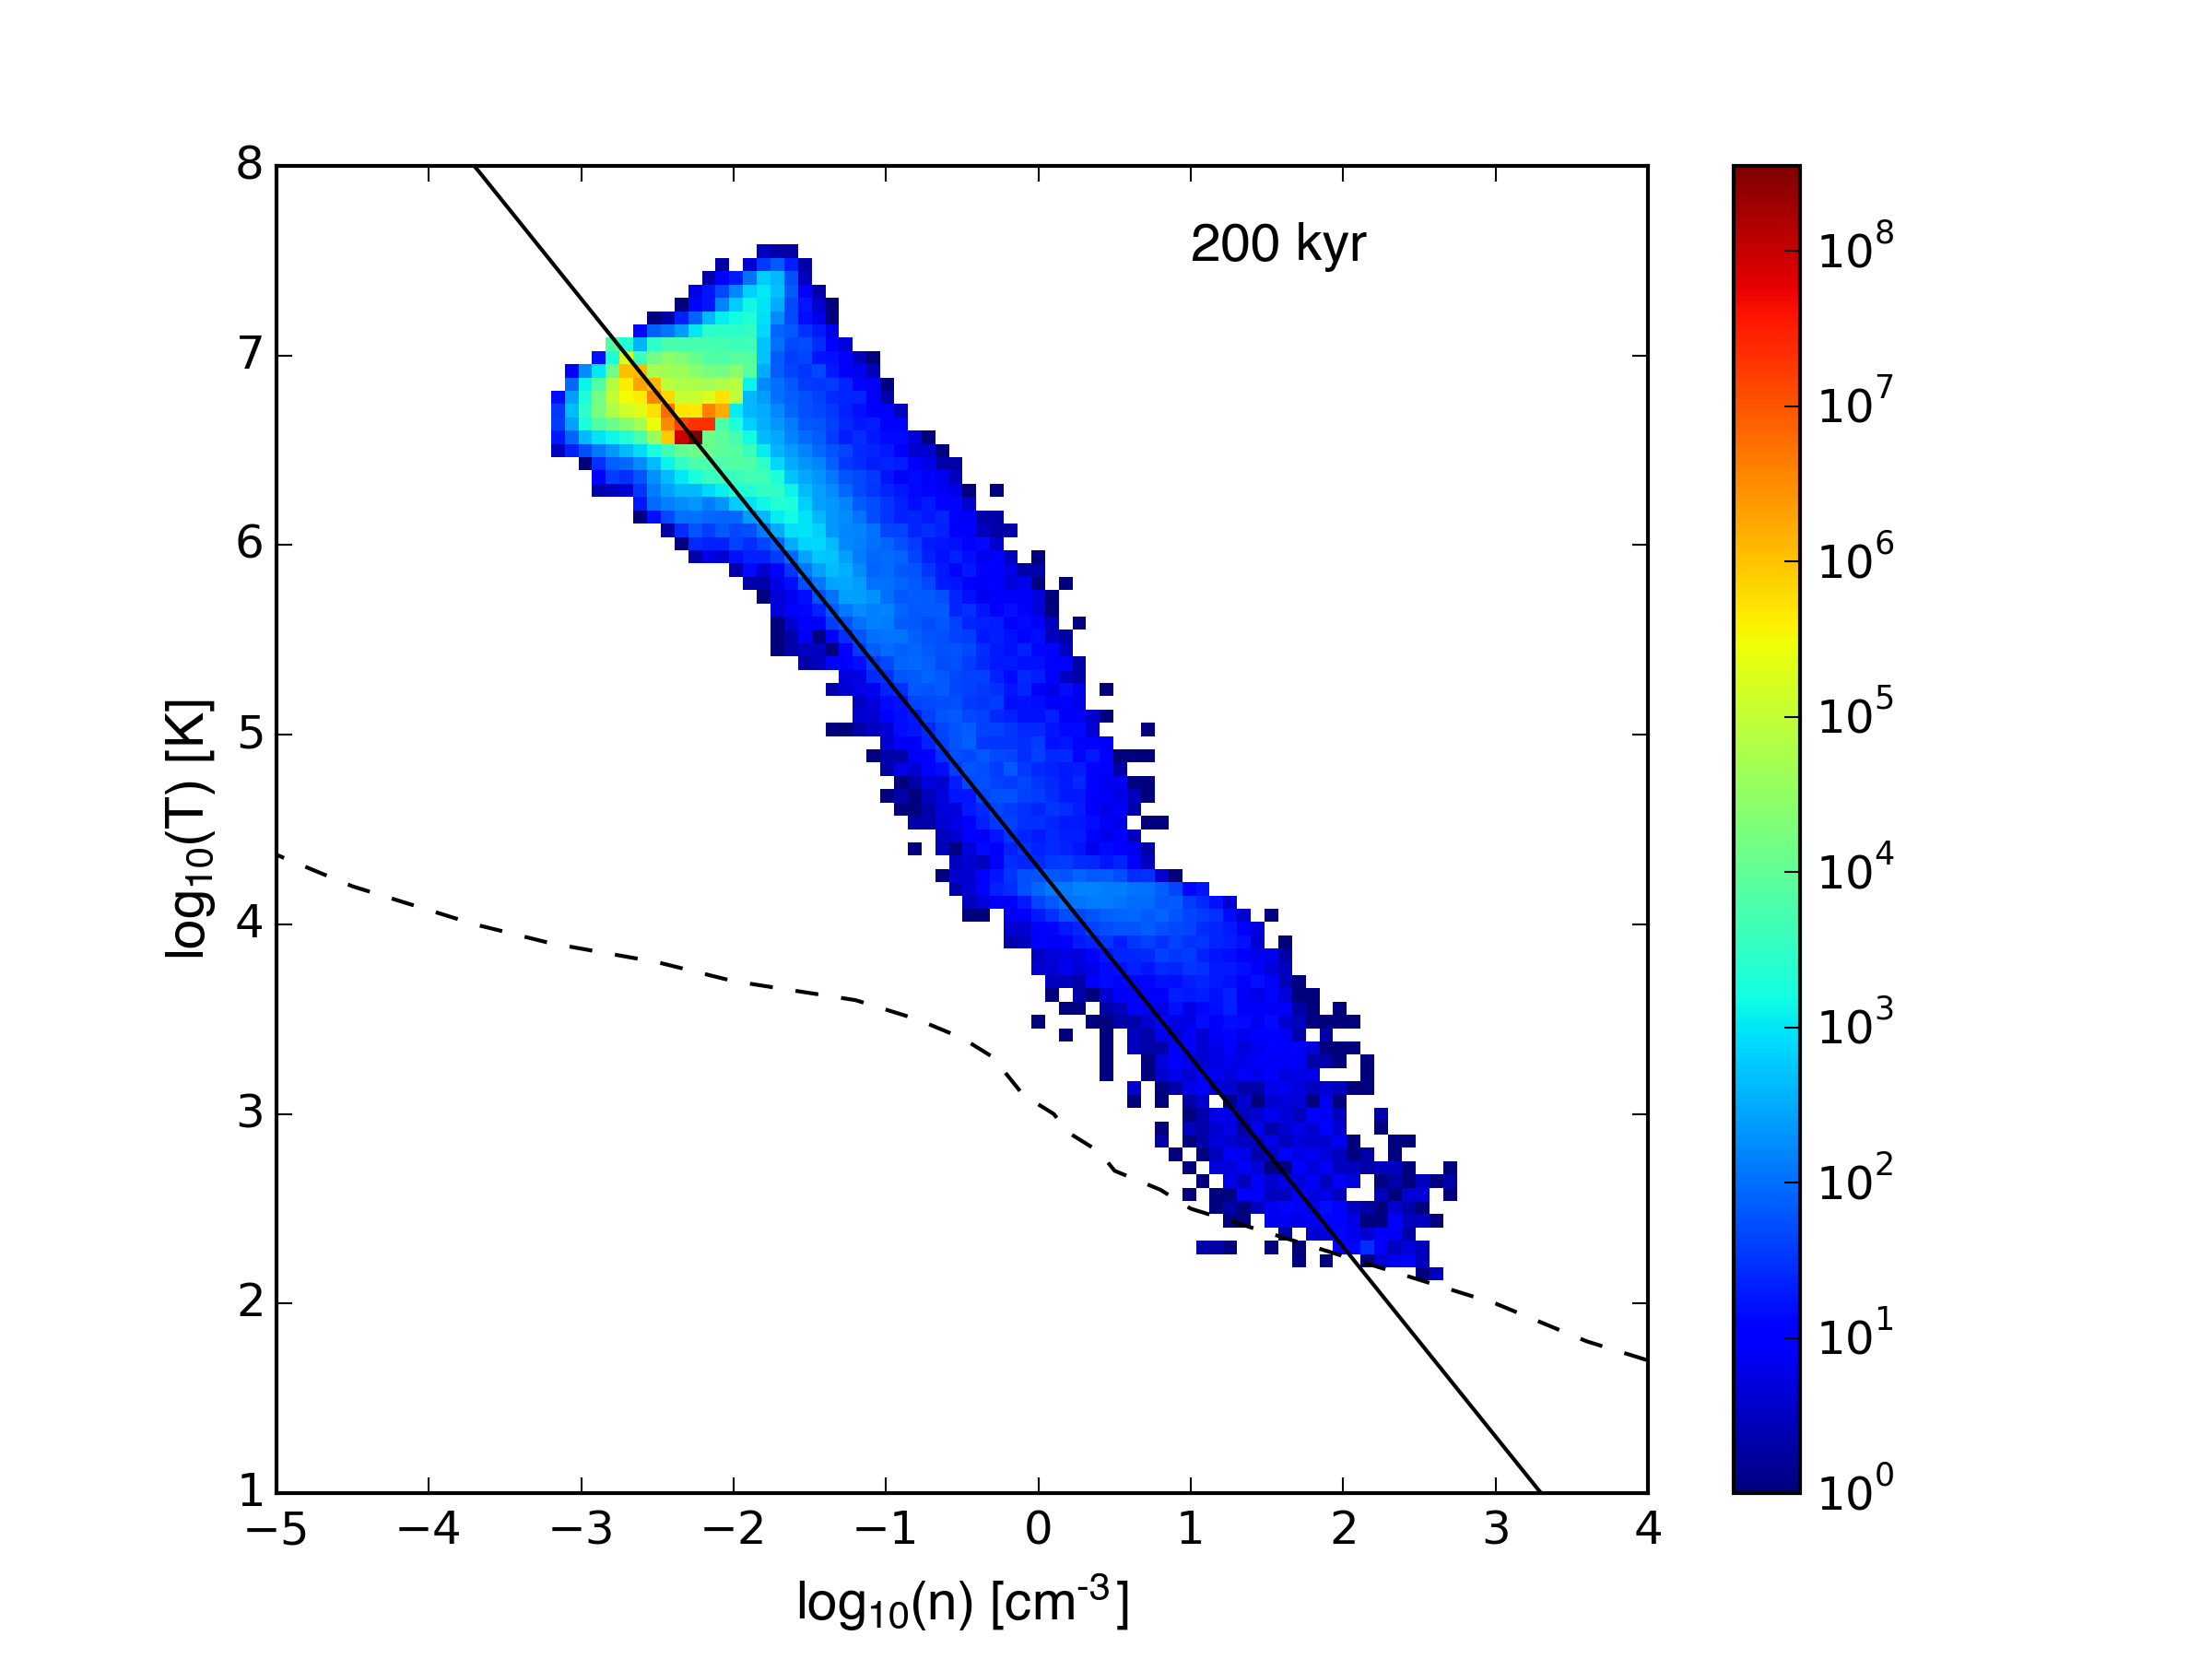
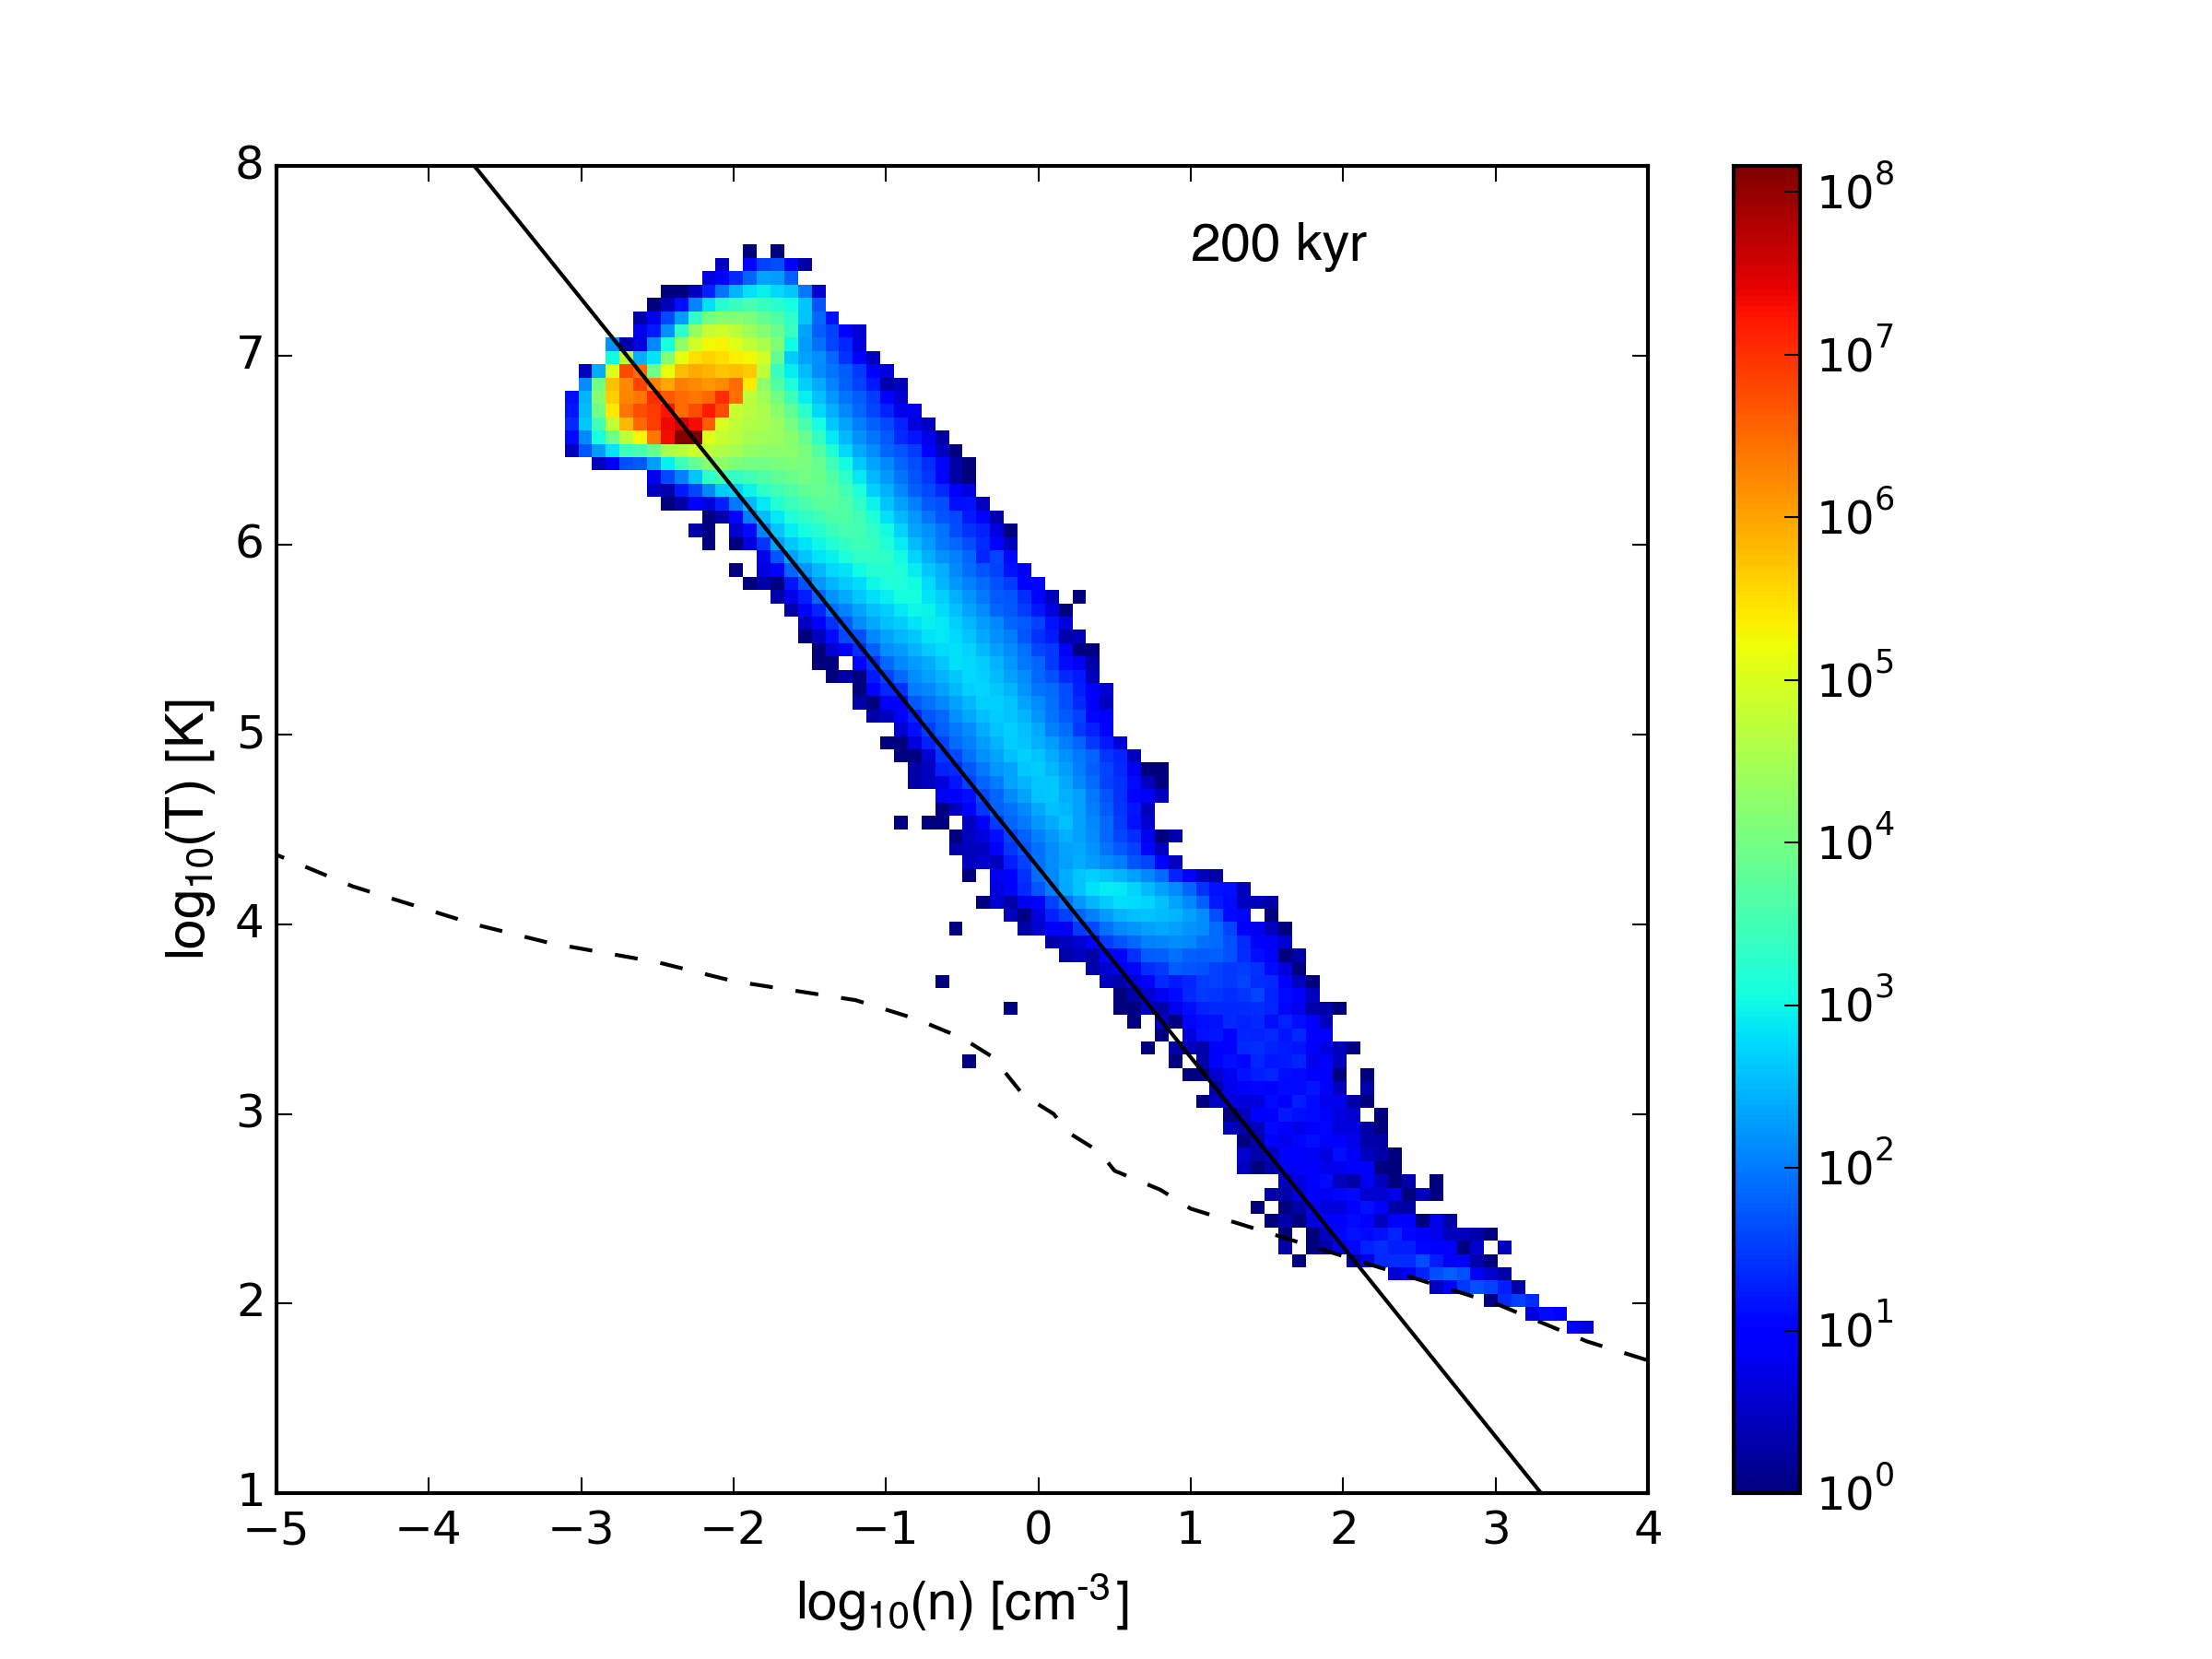
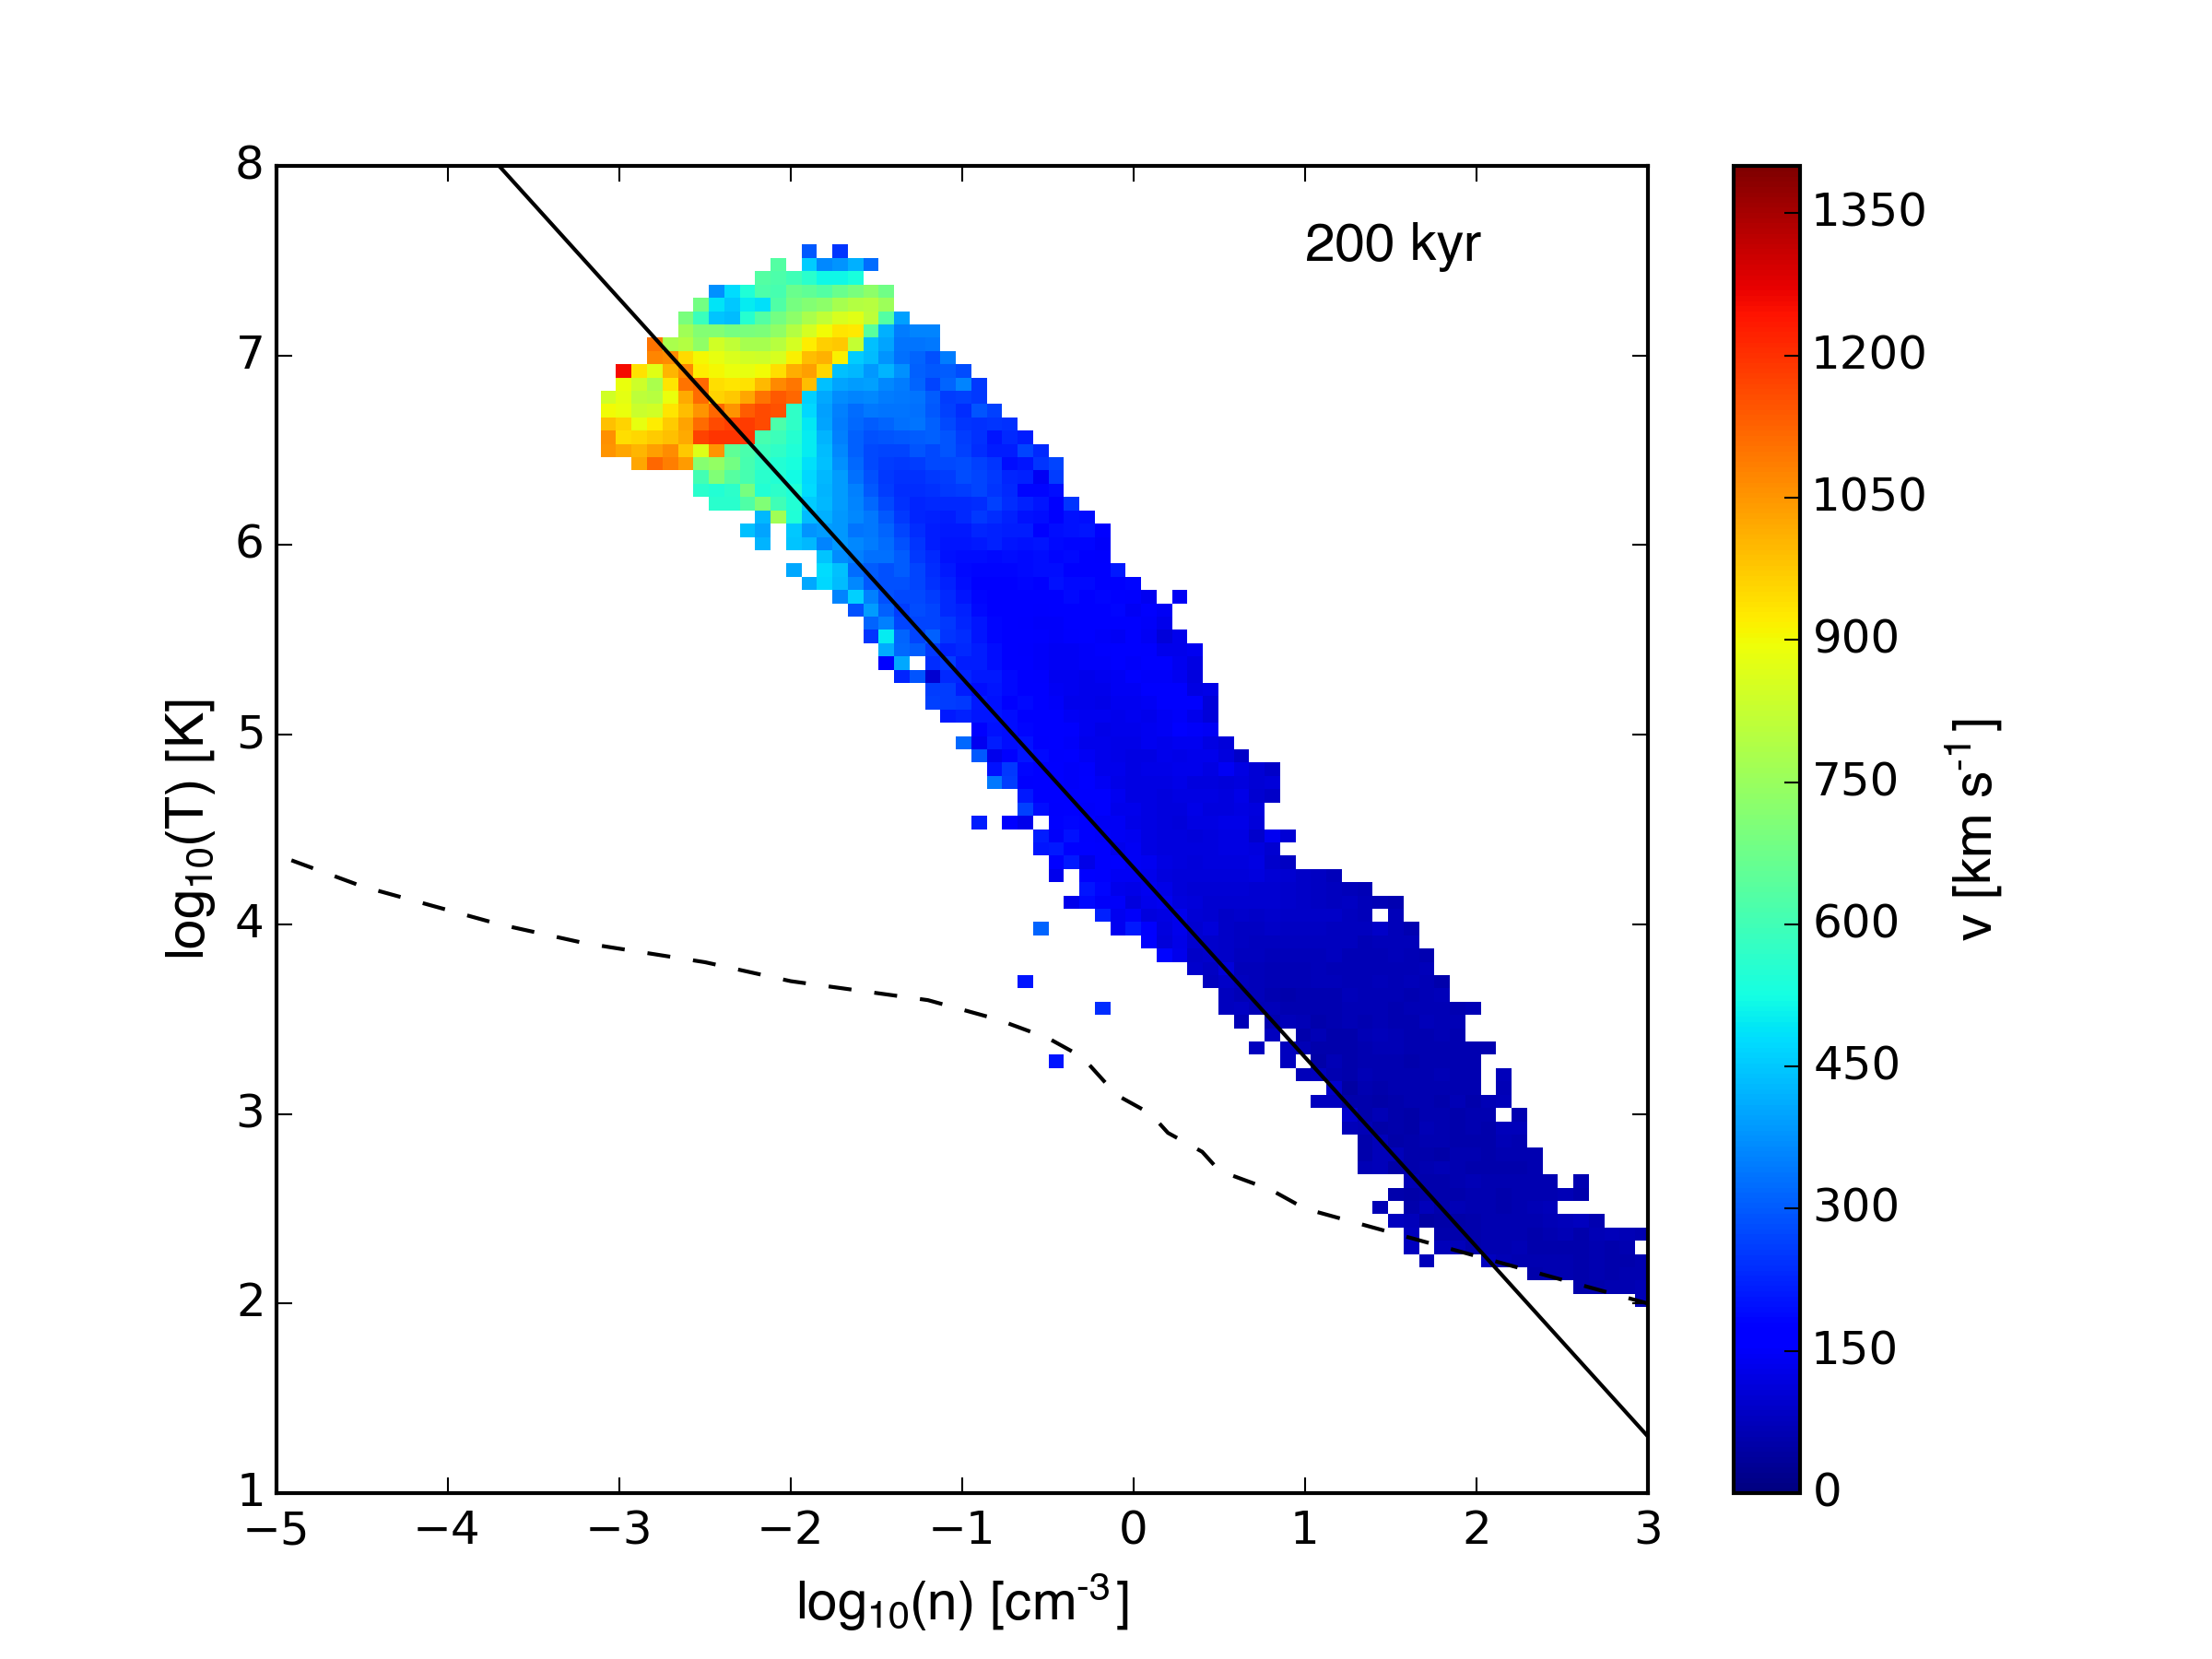
Density-temperature plots (low res followed by high res):
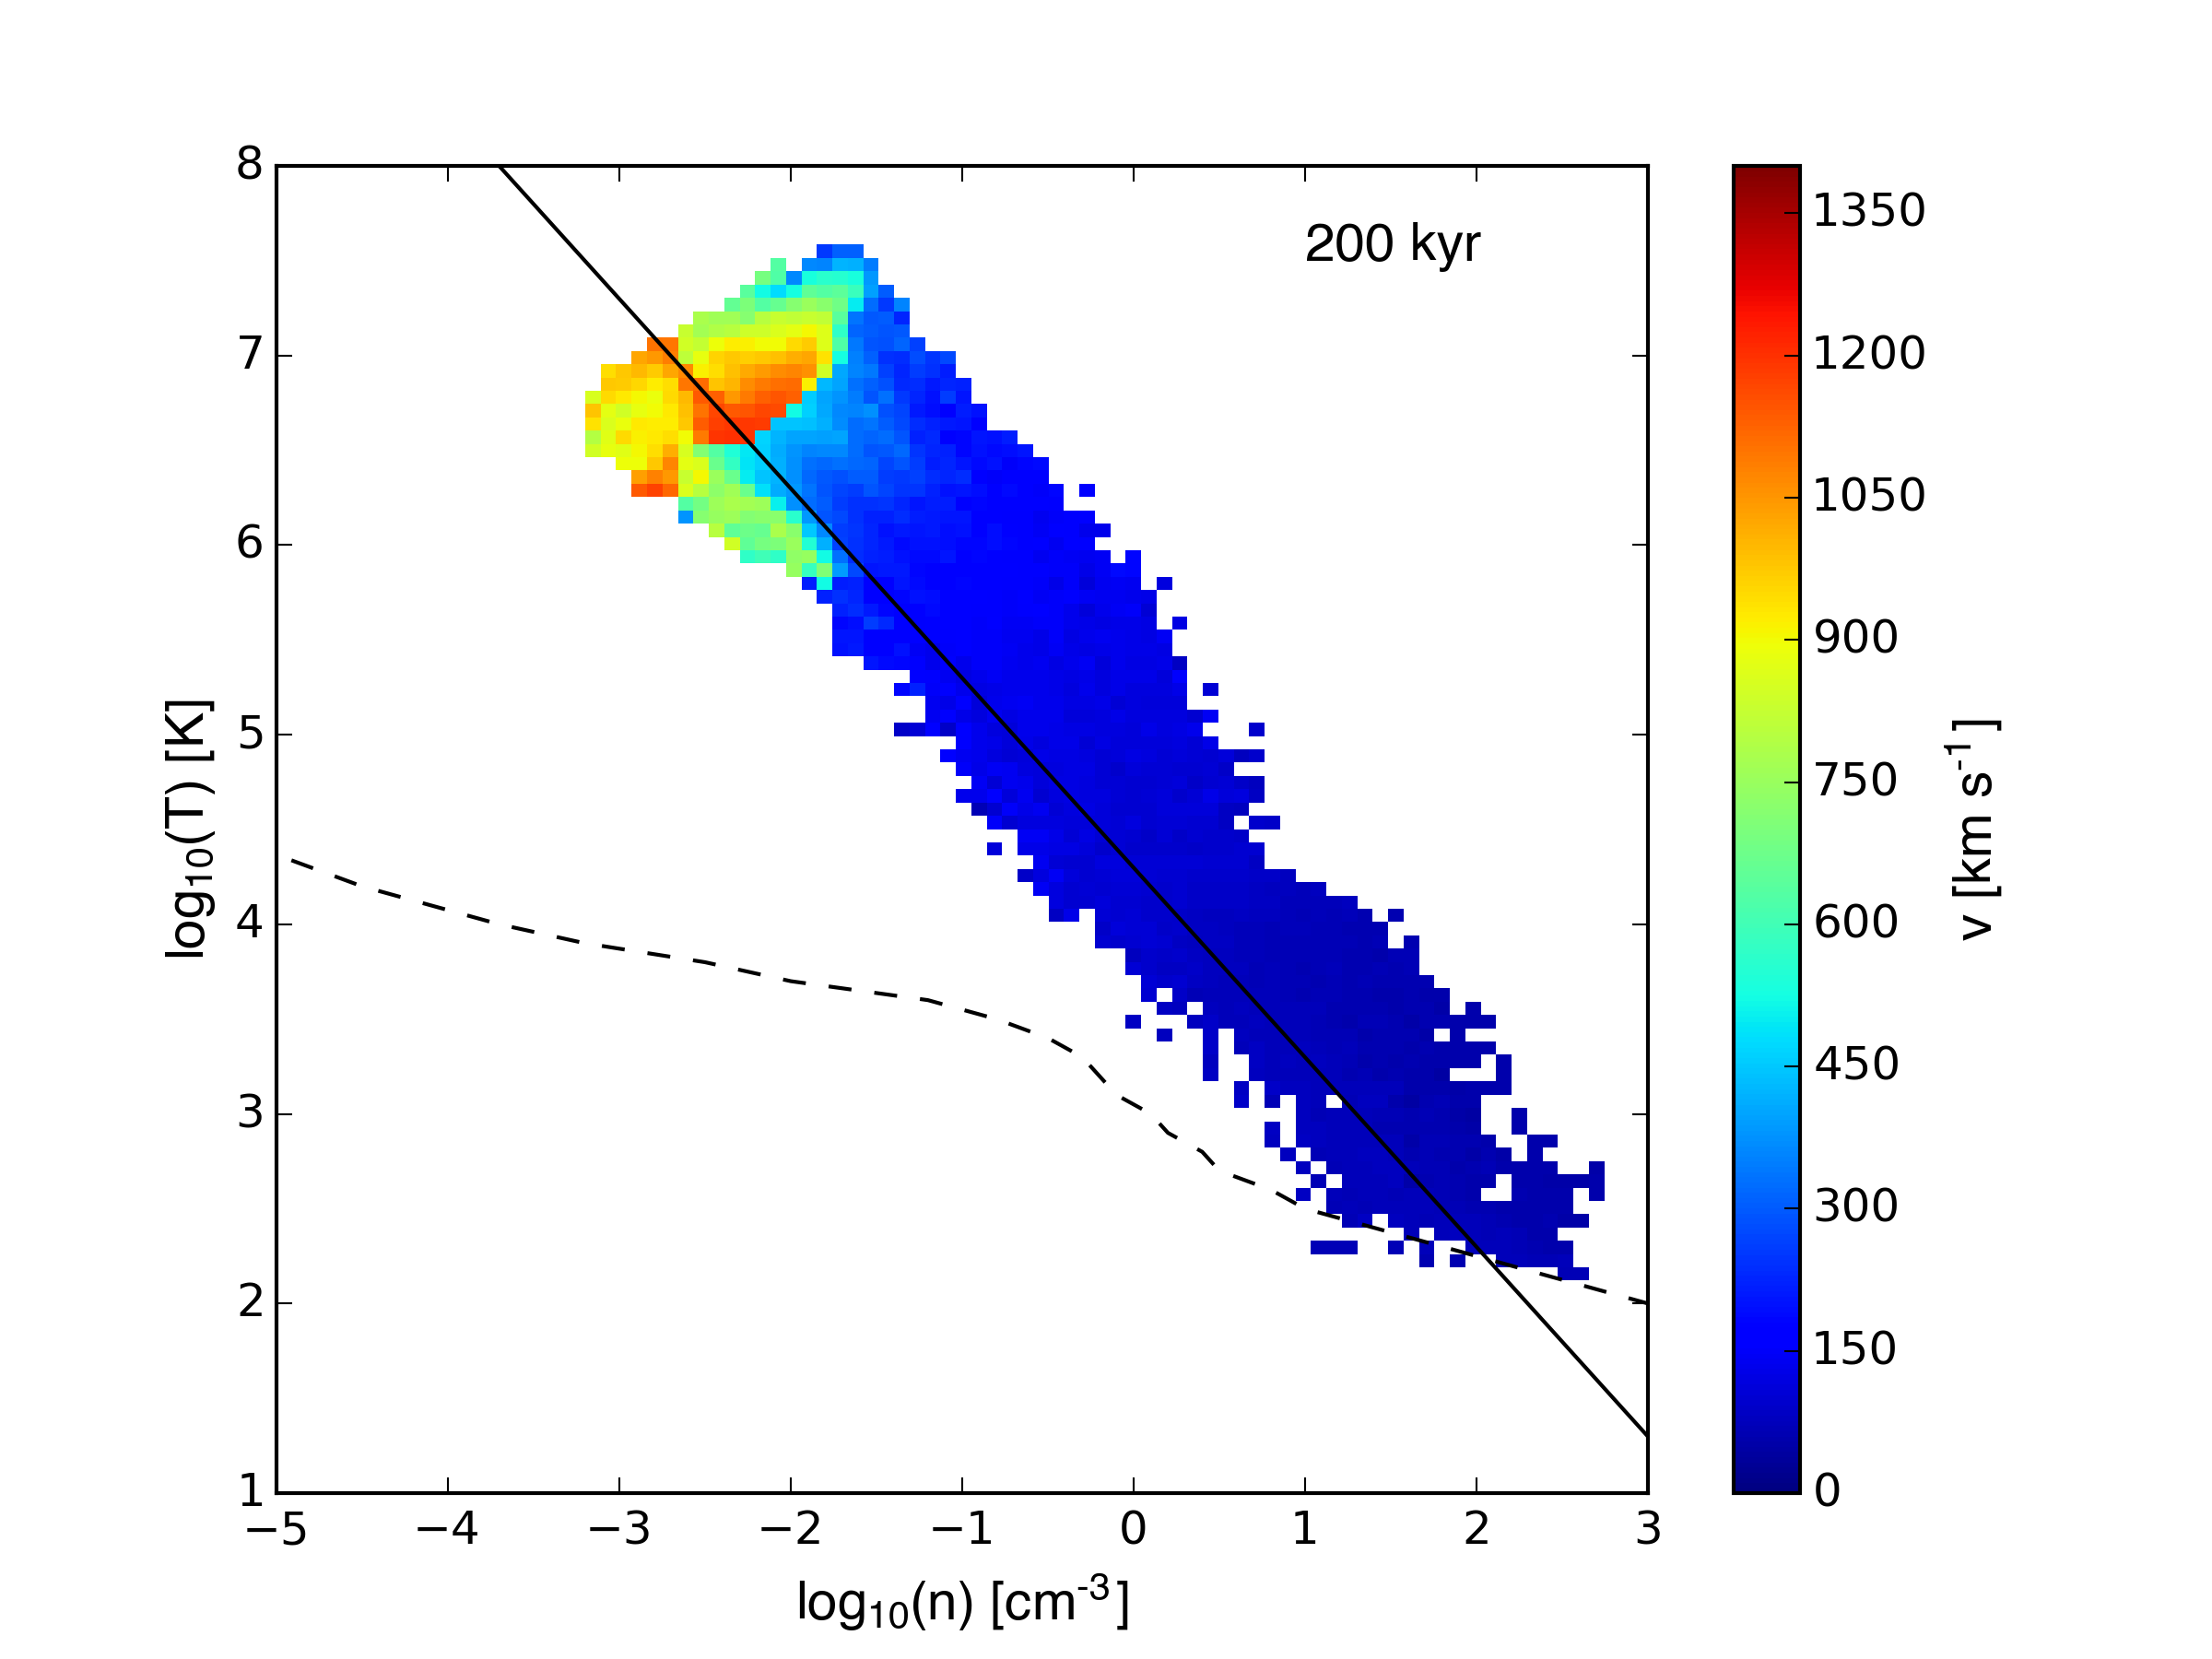
Velocity-weighted density-temperature plots:
Density-velocity plots:
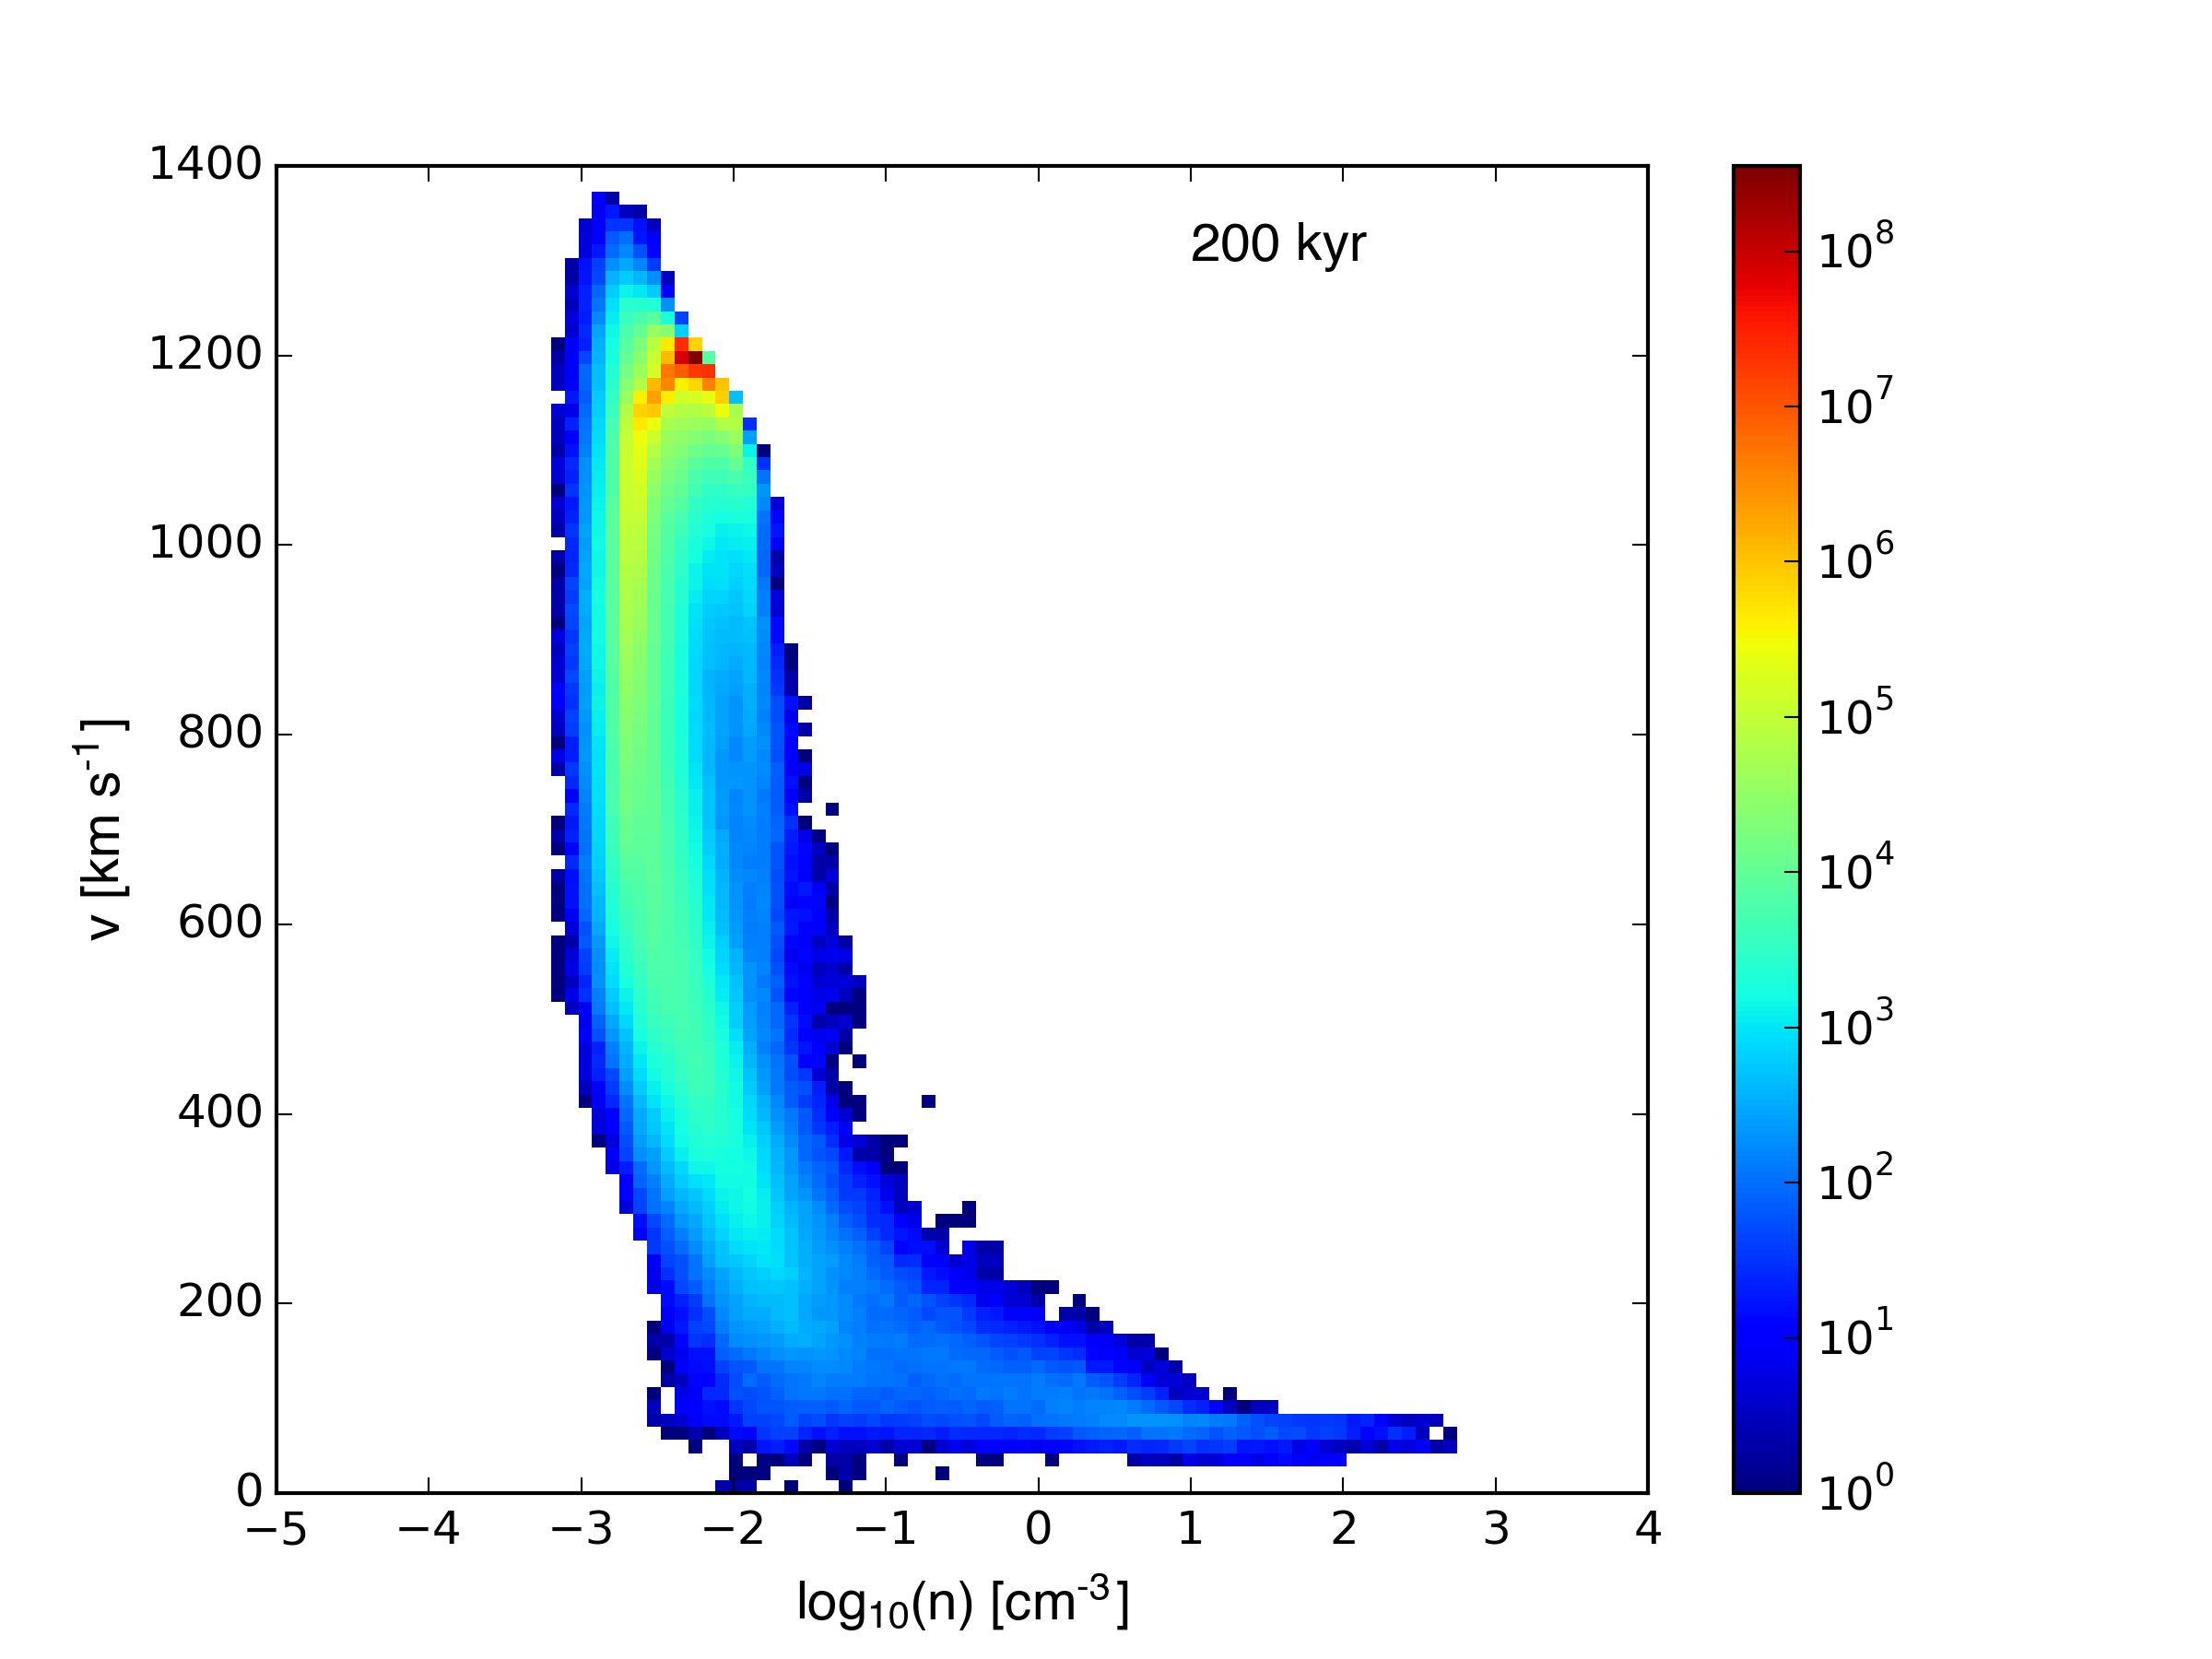
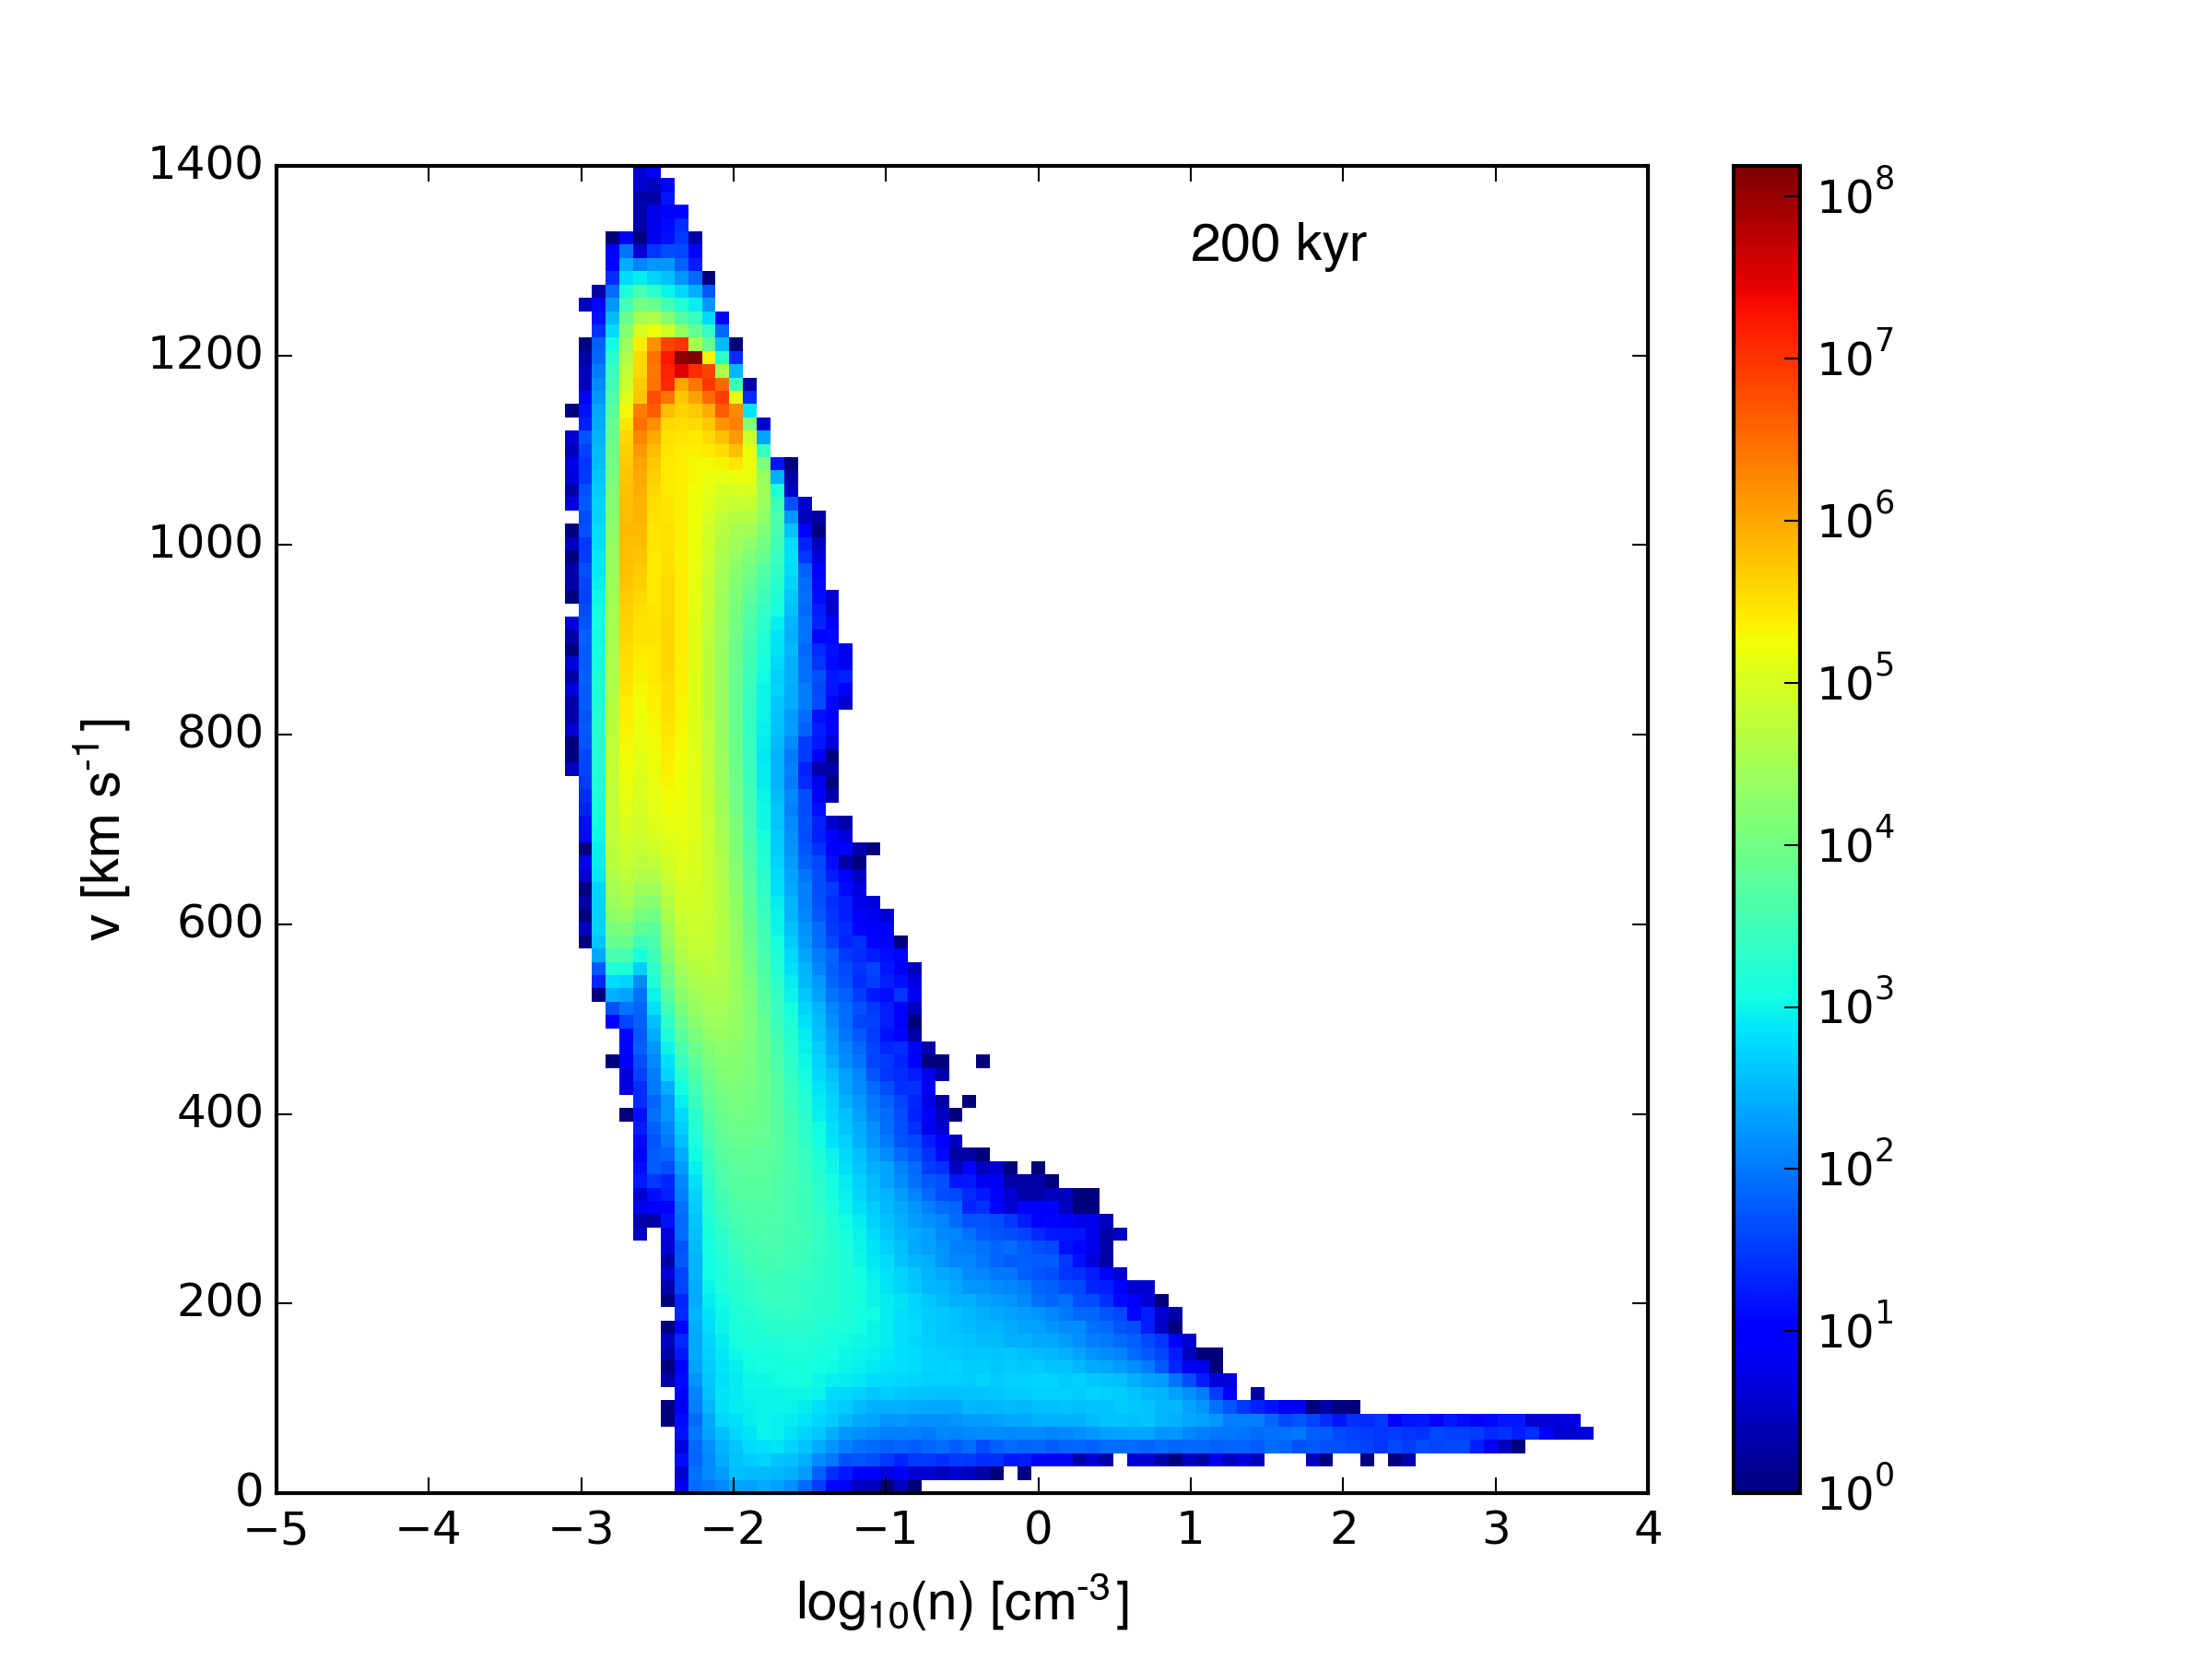
Clearly, in the high resolution sim, the cloud is fragmenting much more quickly. The maximum densities for individual cells are also a factor of ~4 higher in the high resolution version, although this behavior was expected based on the results of 1D radiative shock simulations.