Integrated Mass and Momentum Evolution
June 10, 2016
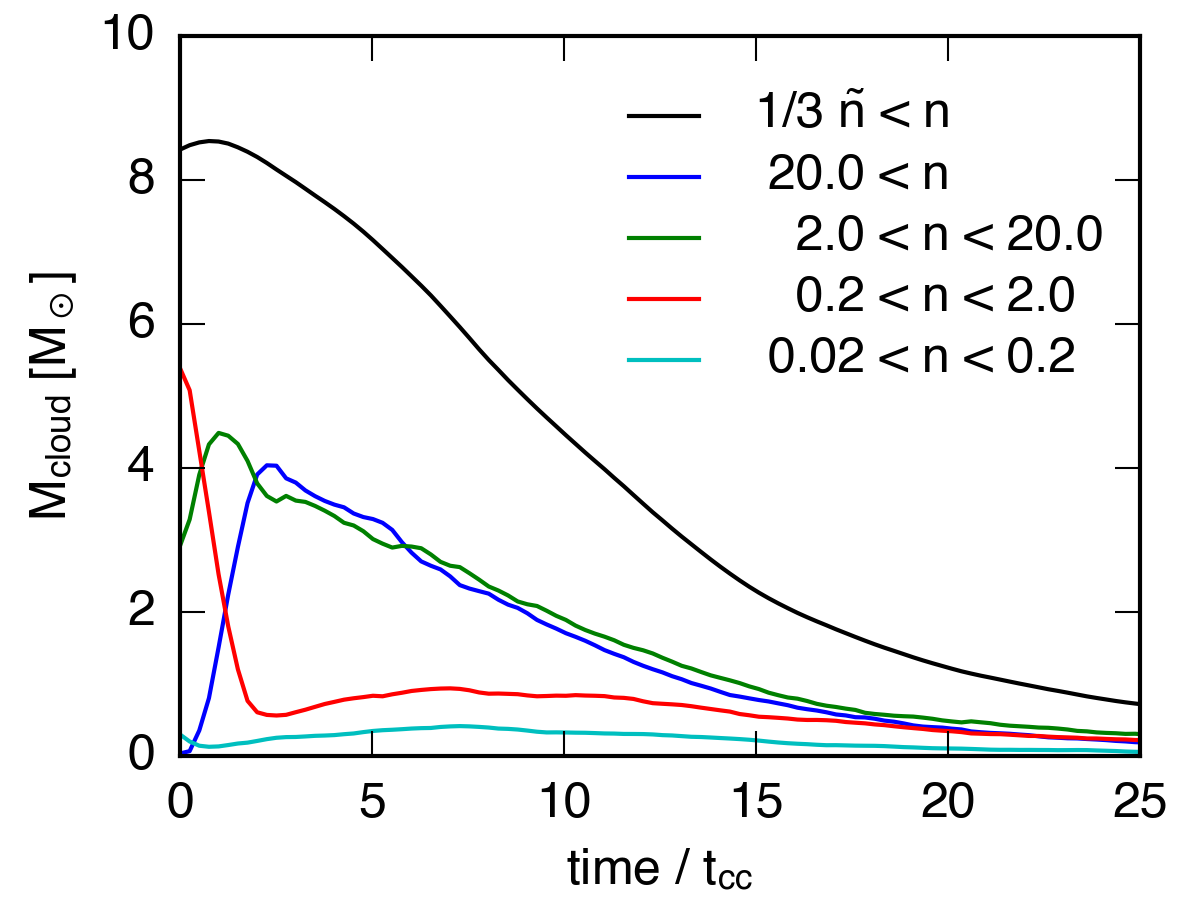
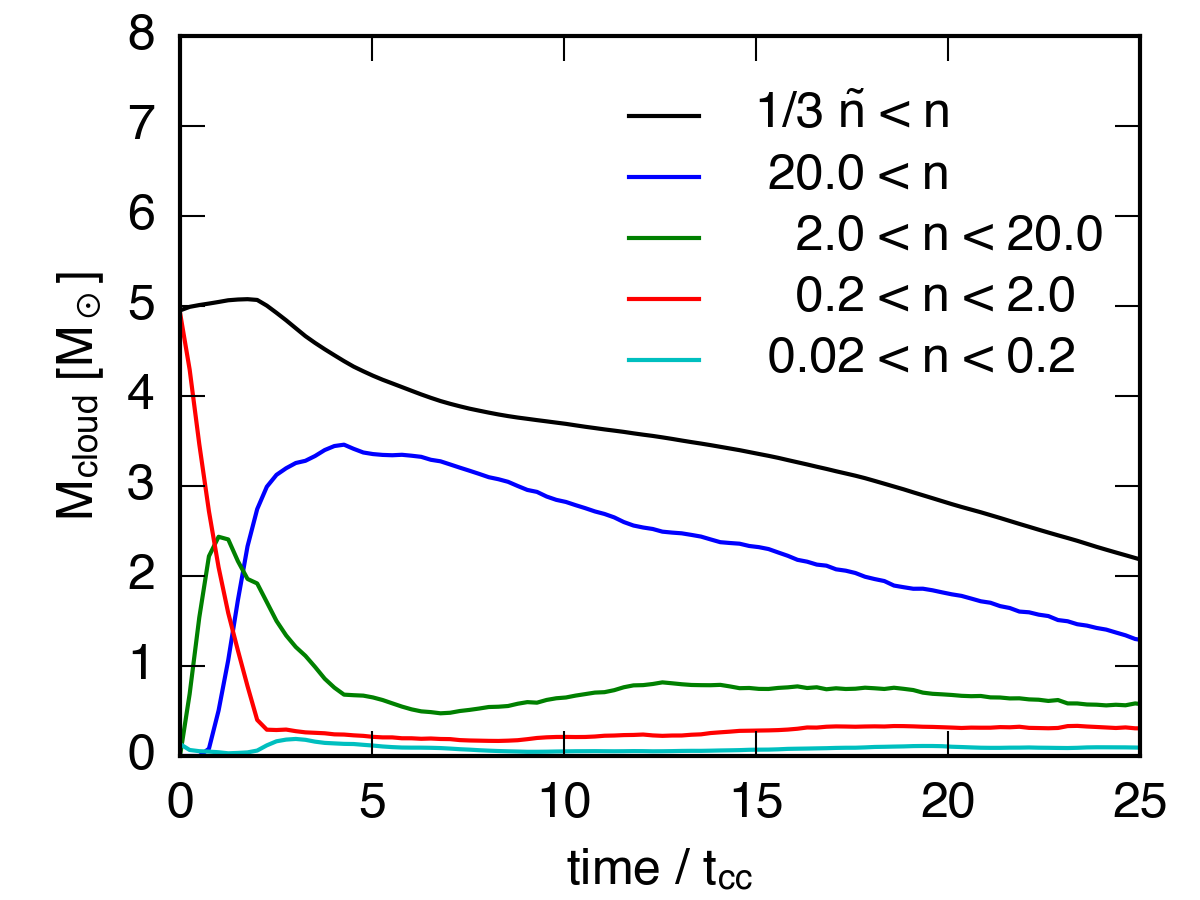
The following are plots of the integrated mass in different density bins for each of the 6 high resolution simulations I’ve run. On the y-axis I’ve plotted the total mass in each density bin, including the total mass above 1/3 the original median density of the cloud.
\(\tilde{n} = 1\) cloud:
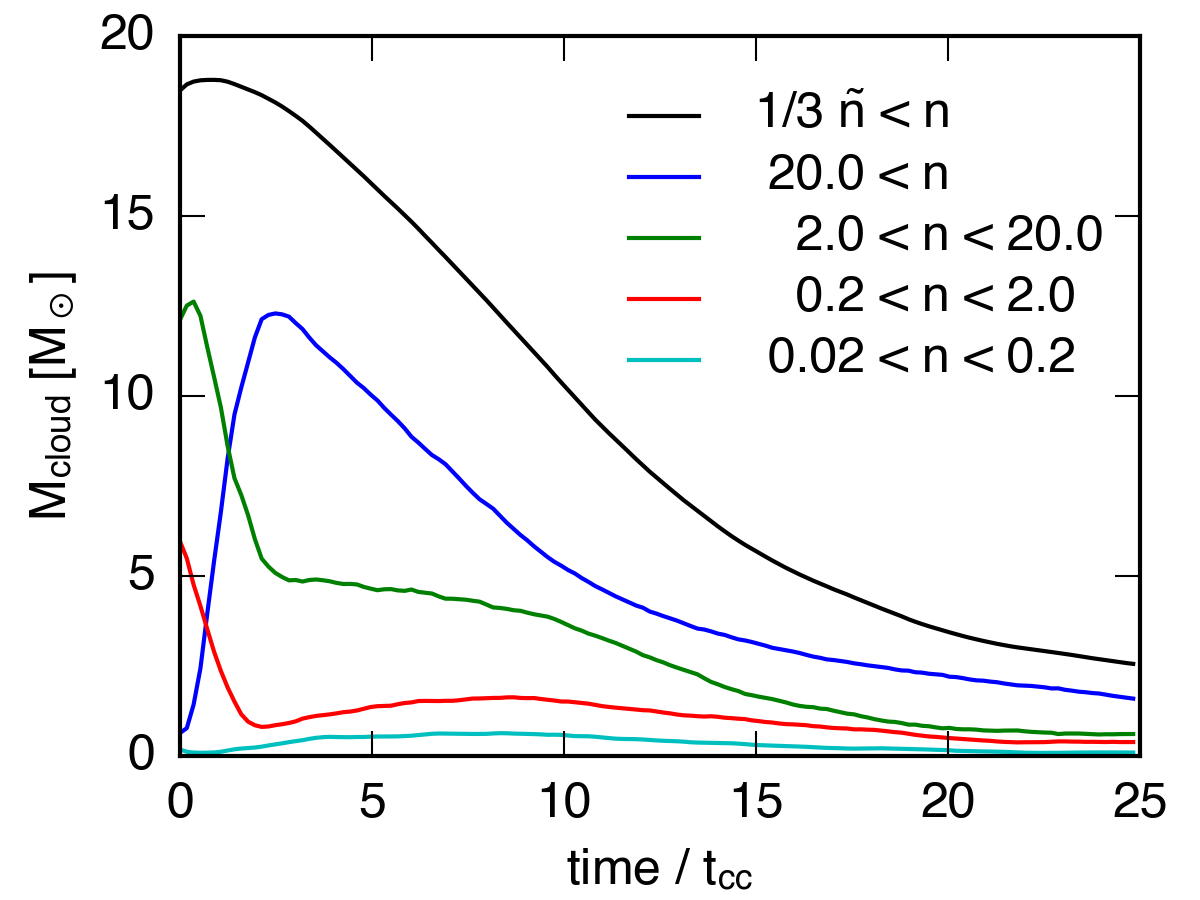
\(\tilde{n} = 1\) sphere:
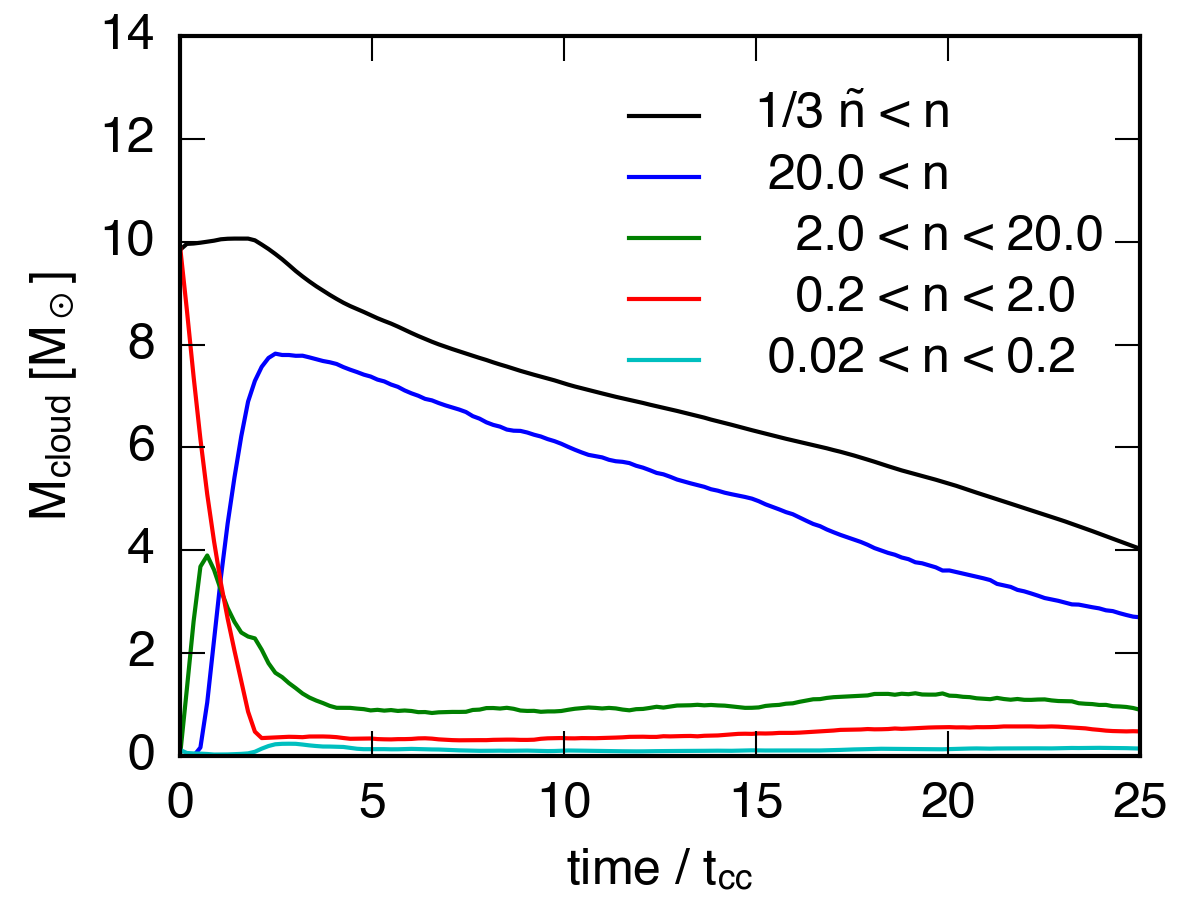
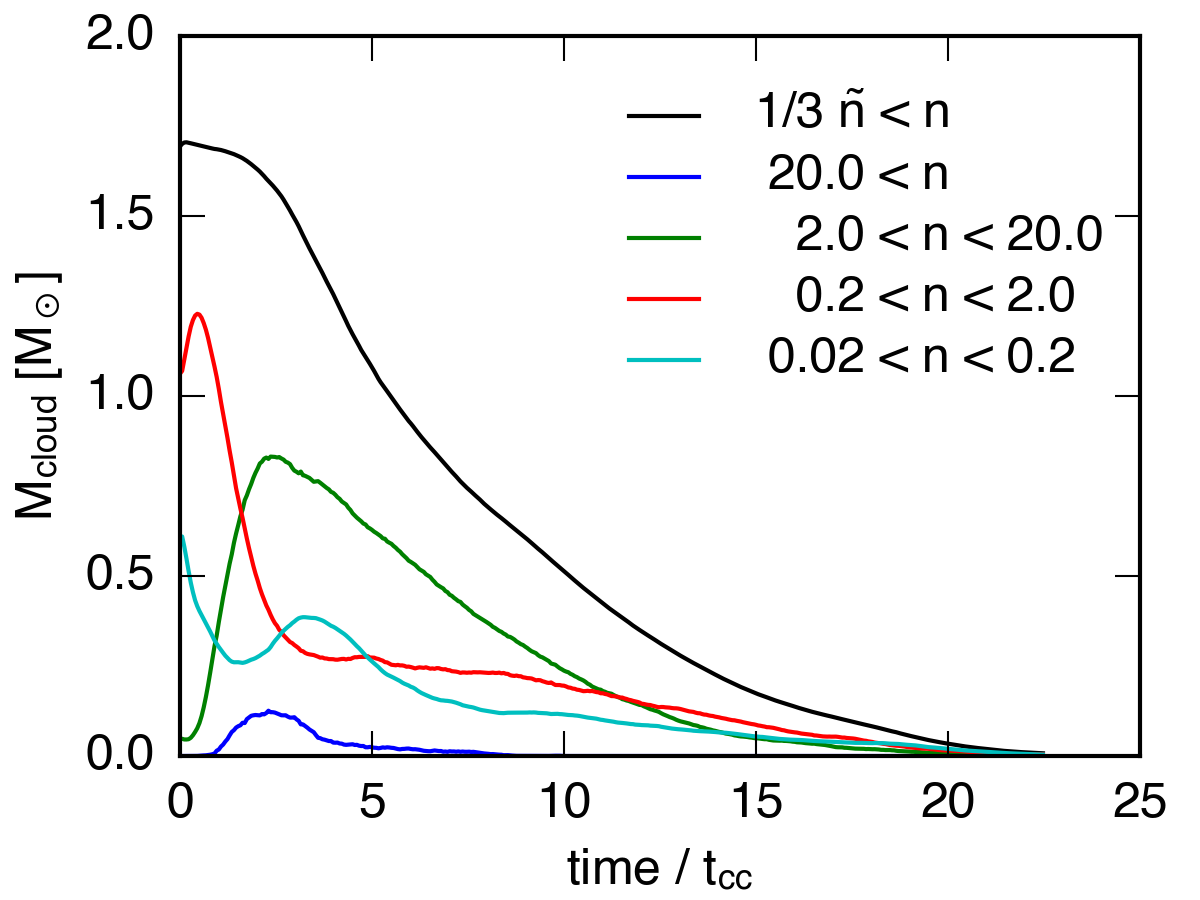
\(\tilde{n} = 0.5\) cloud:
\(\tilde{n} = 0.5\) sphere:
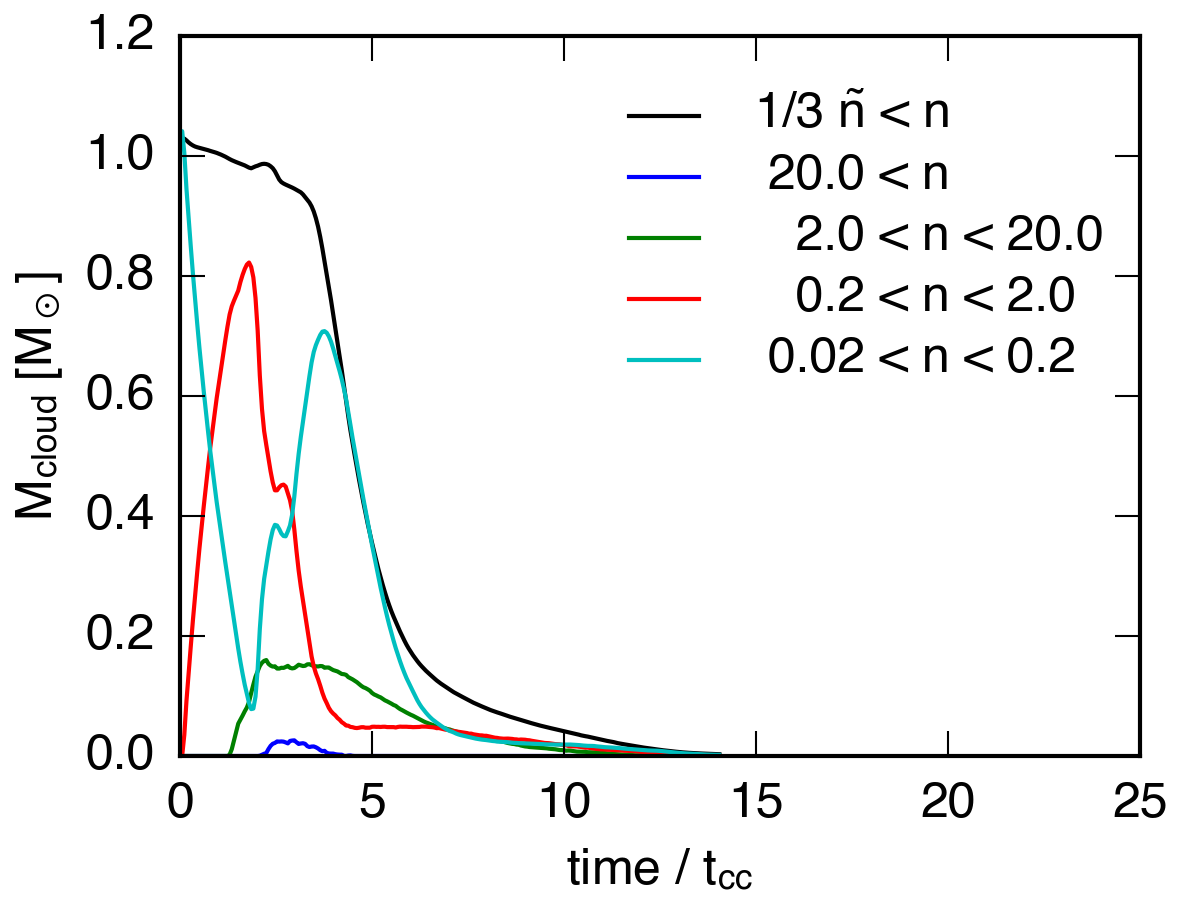
\(\tilde{n} = 0.1\) cloud:
\(\tilde{n} = 0.1\) sphere:
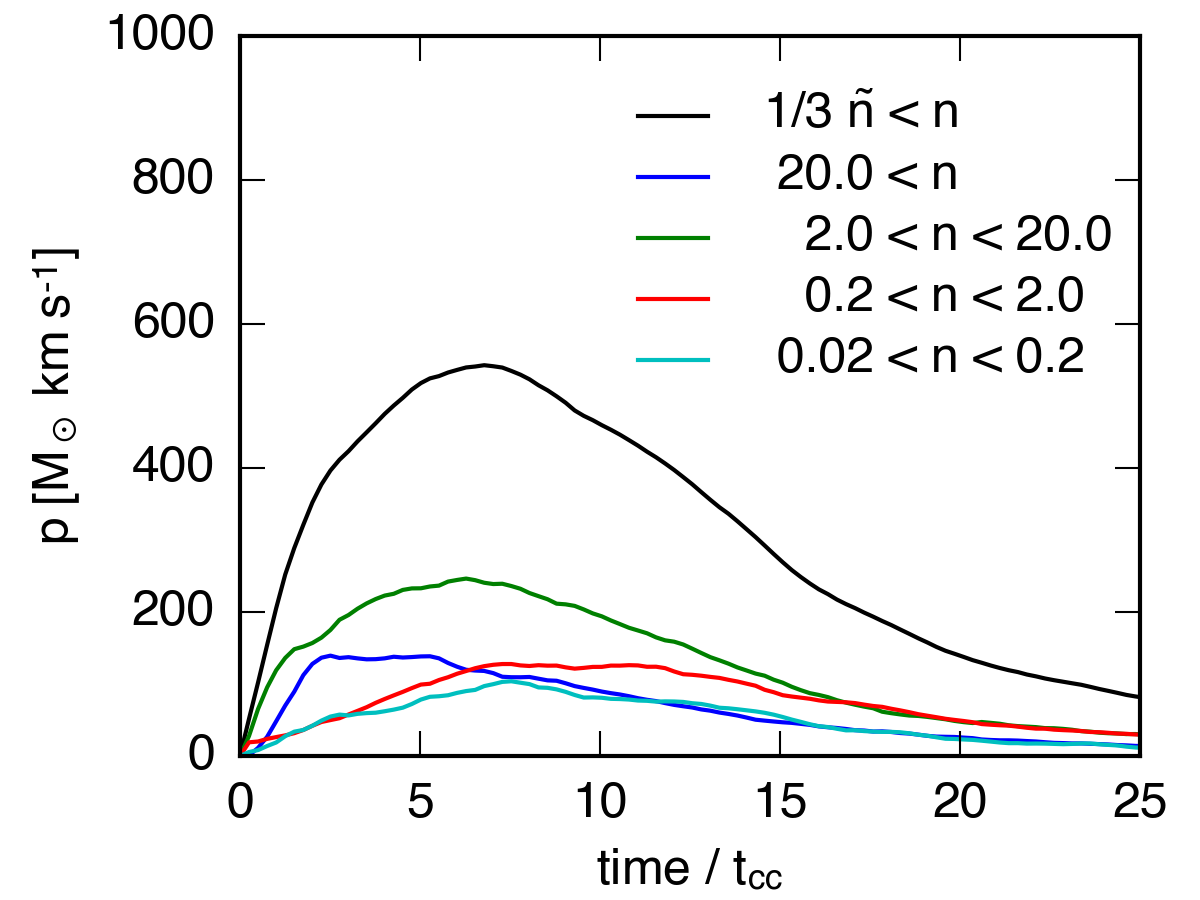
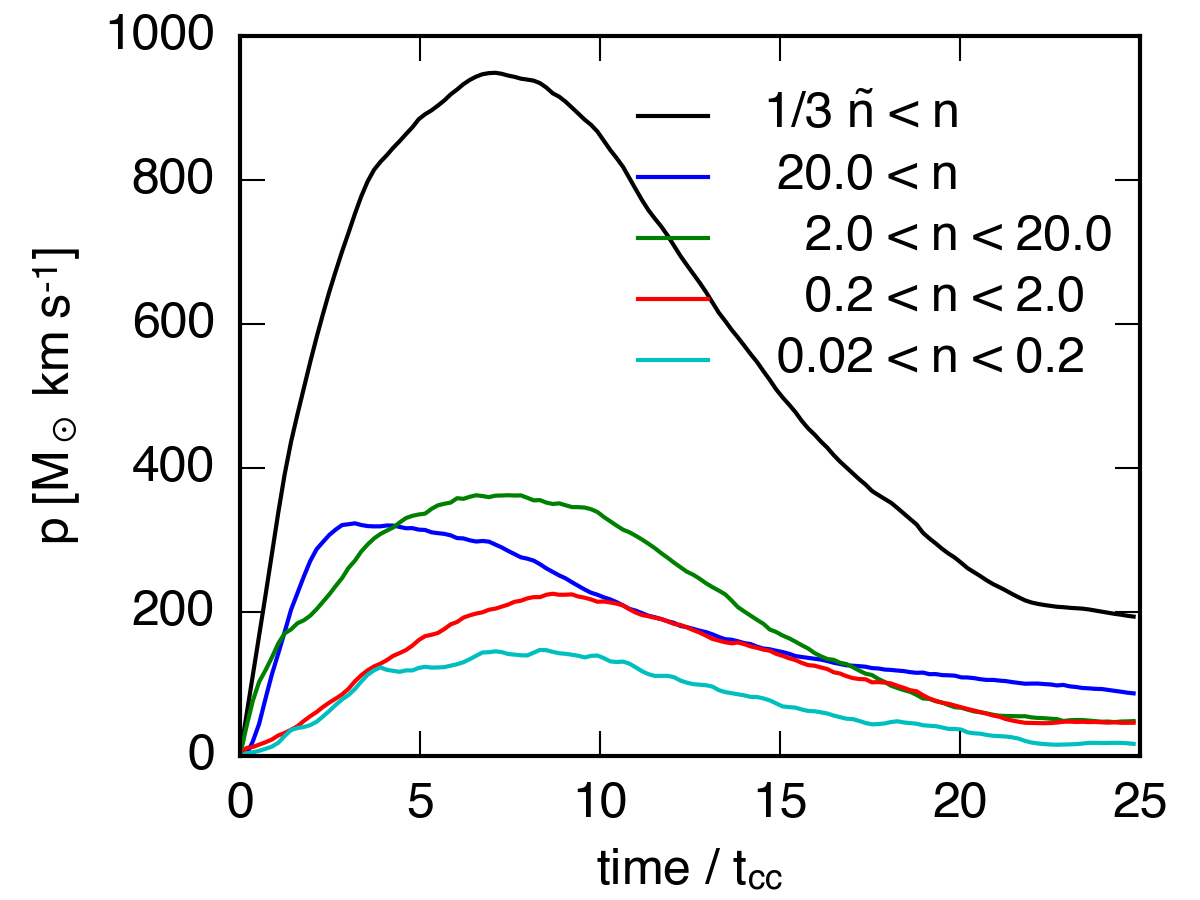
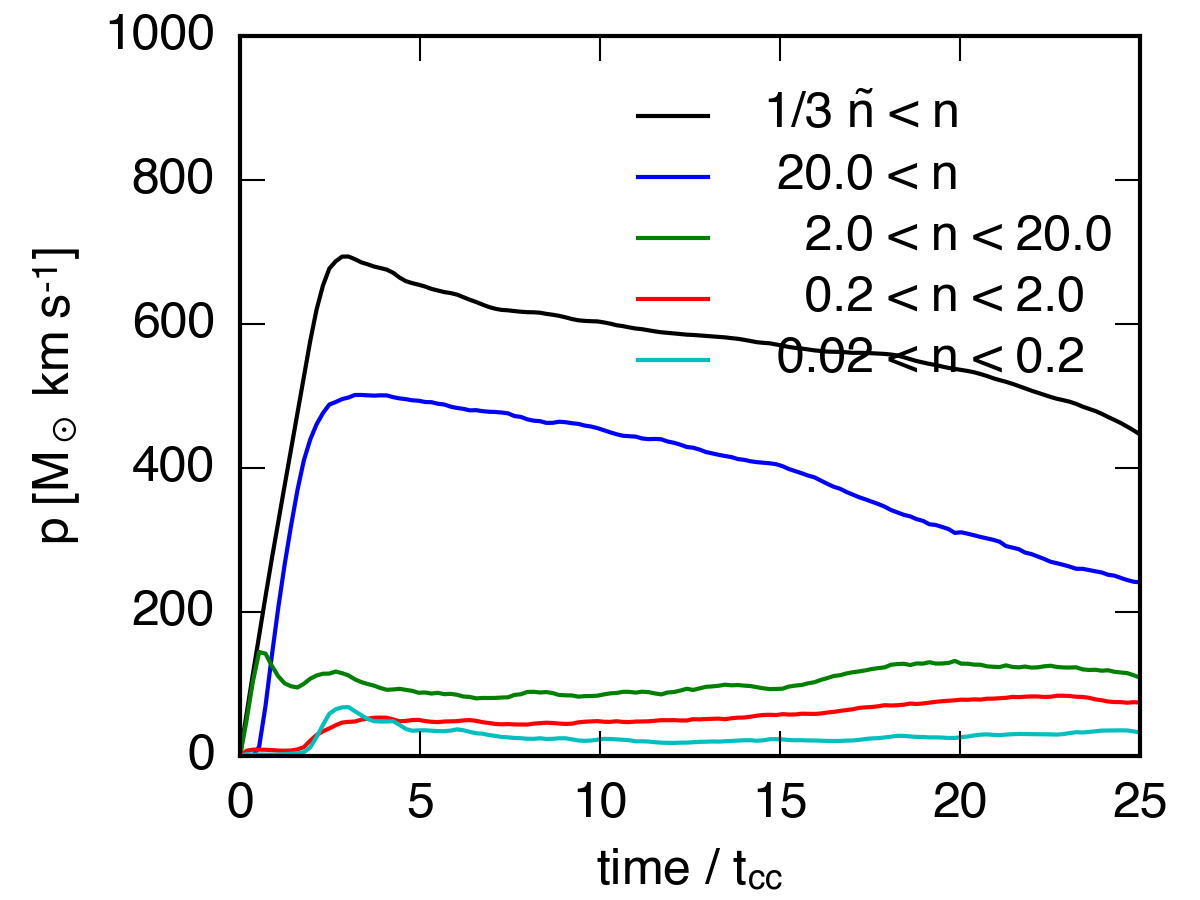
I’ve also plotted the integrated momentum for each of the 3 highest surface density simulations, using the same density bins.
\(\tilde{n} = 1\) cloud:
\(\tilde{n} = 1\) sphere:
\(\tilde{n} = 0.5\) cloud: