Density Profile Effects
March 25, 2016
In the last post I noted that there were clear differences between the low and high resolution \(n_h = 1\) cloud simulations at 200 kyr. However, the fact that the clouds started with different density profiles and therefore, different masses was a confounding variable in determining the cause of the different morphologies. Hence, I have rerun the high resolution simulation to 200 kyr with the old density profile.
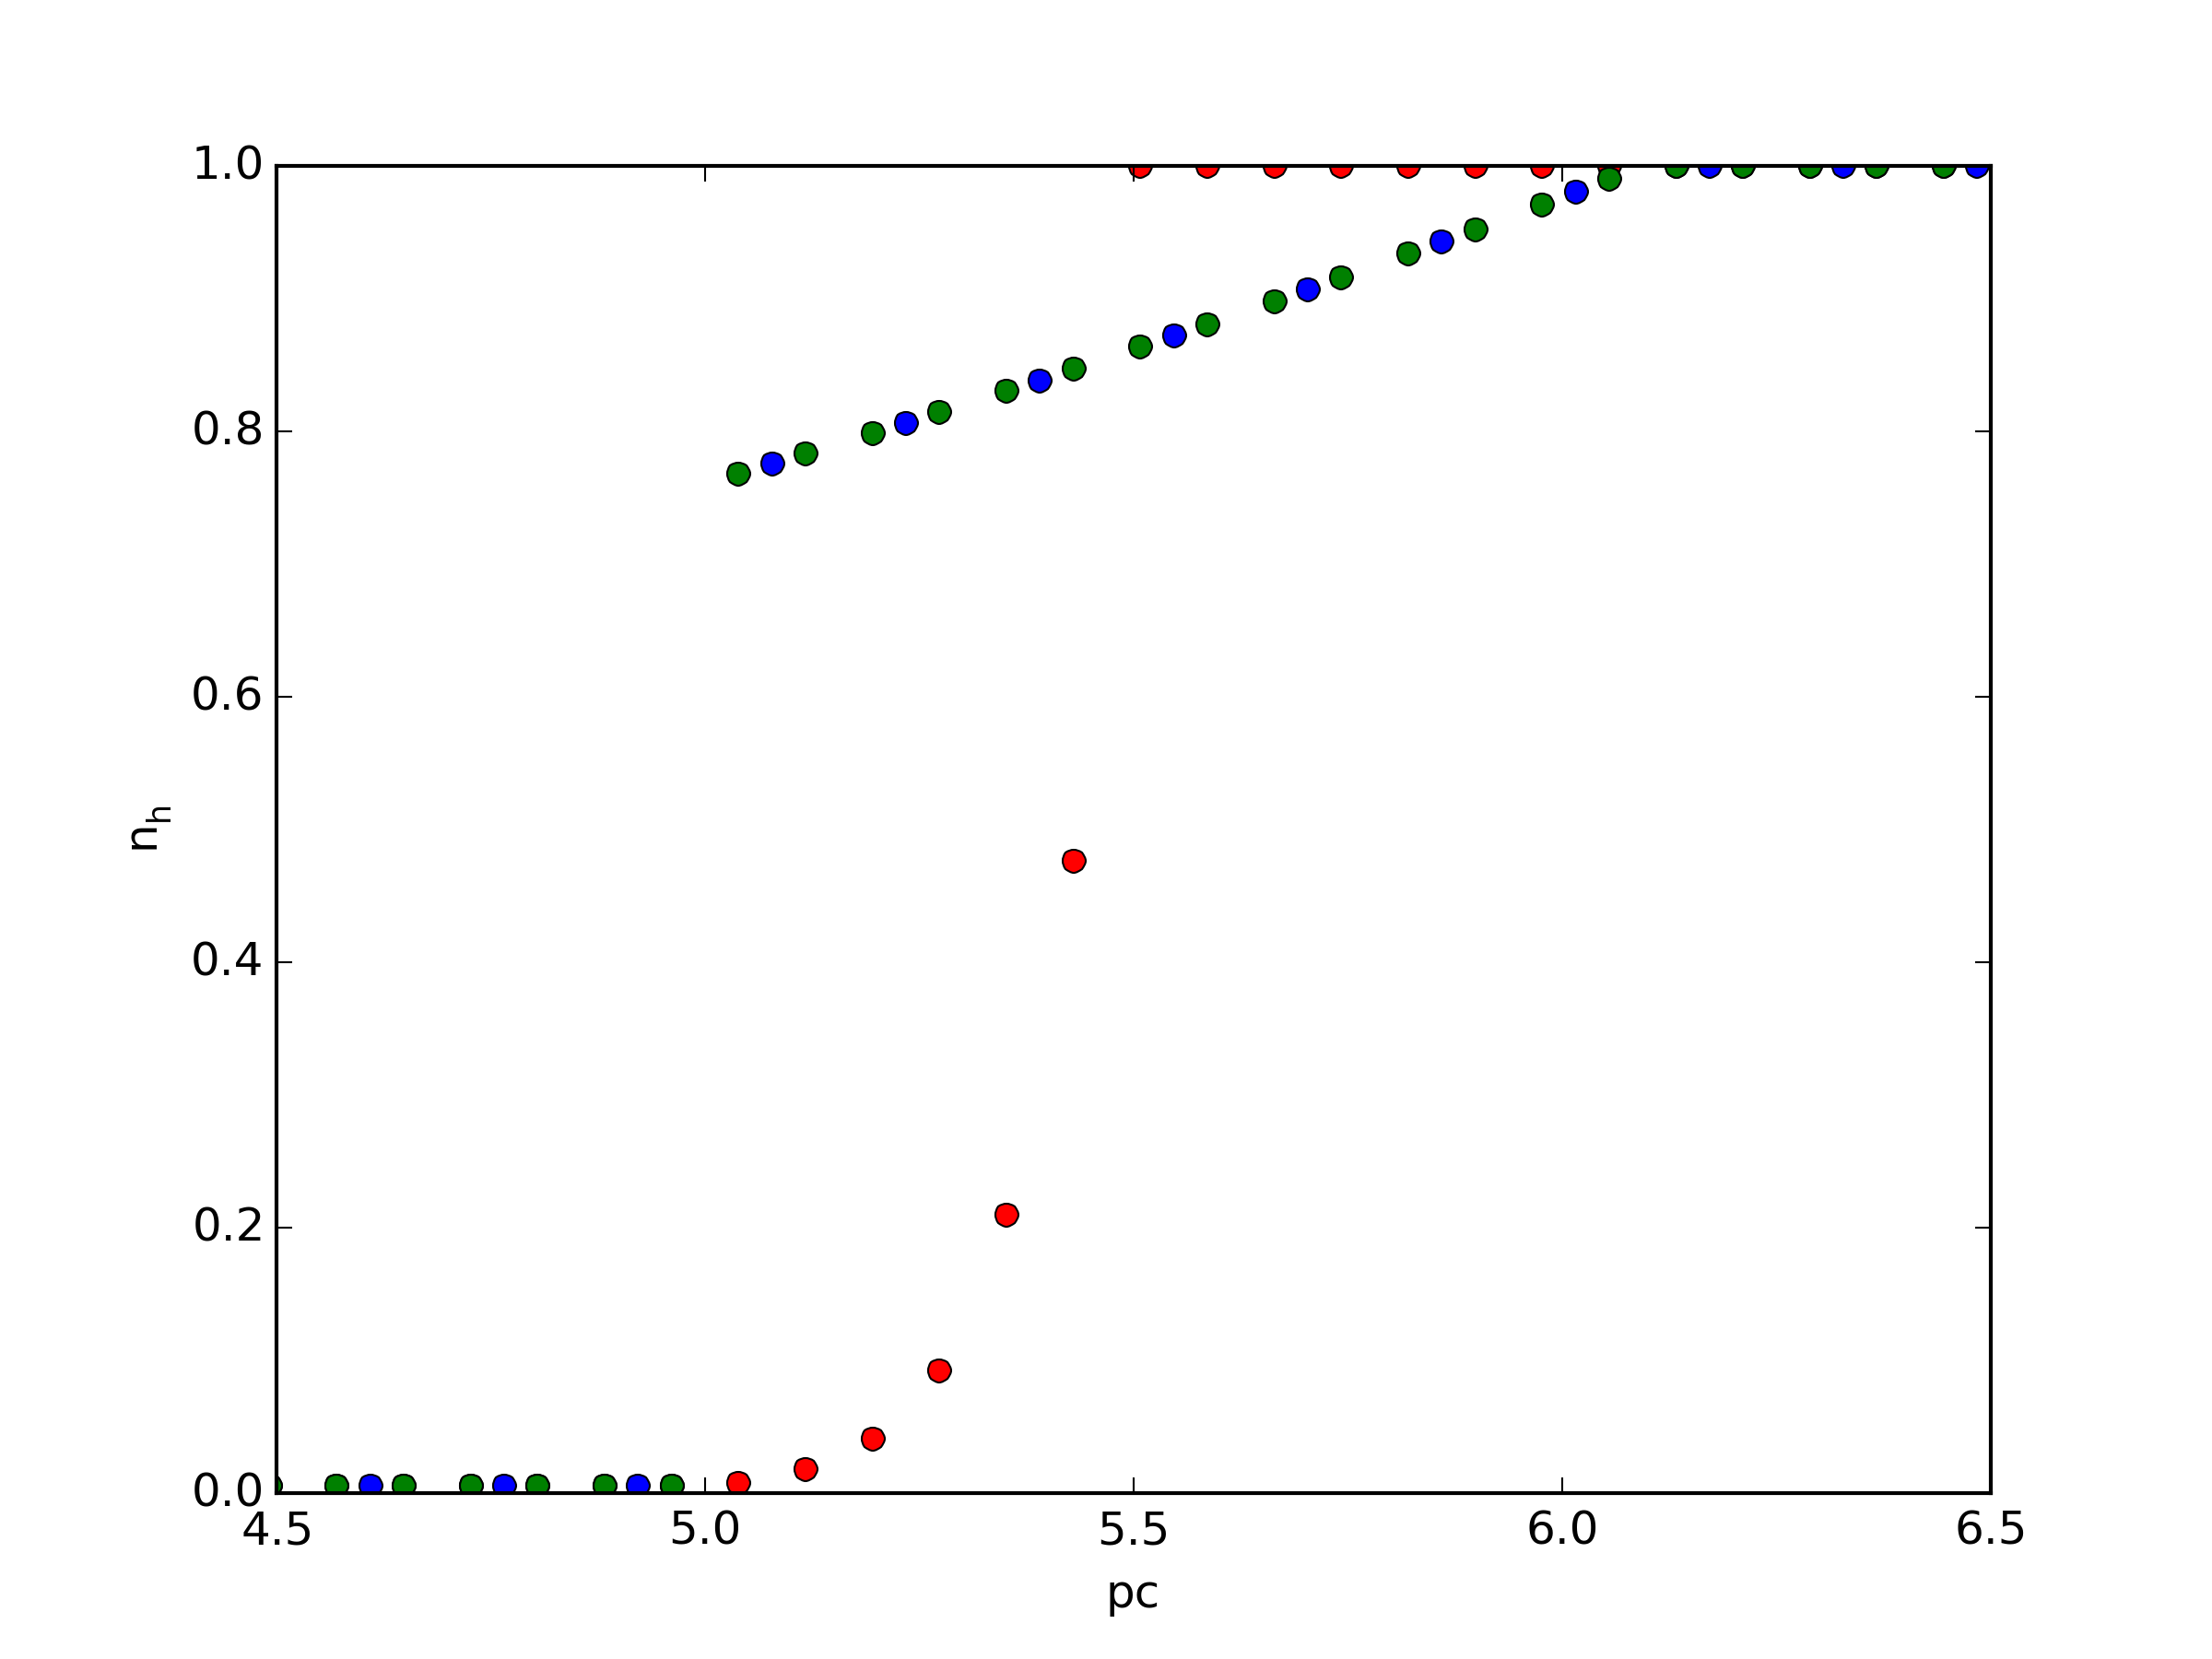
The three profiles are compared in the plot below. The low and high resolution
simulations with the old density profile are shown in blue and green, respectively,
and the high resolution simulation with the new profile is shown in red. The plot is
a 1D slice through the center of the cloud, zoomed in on the outer edge.
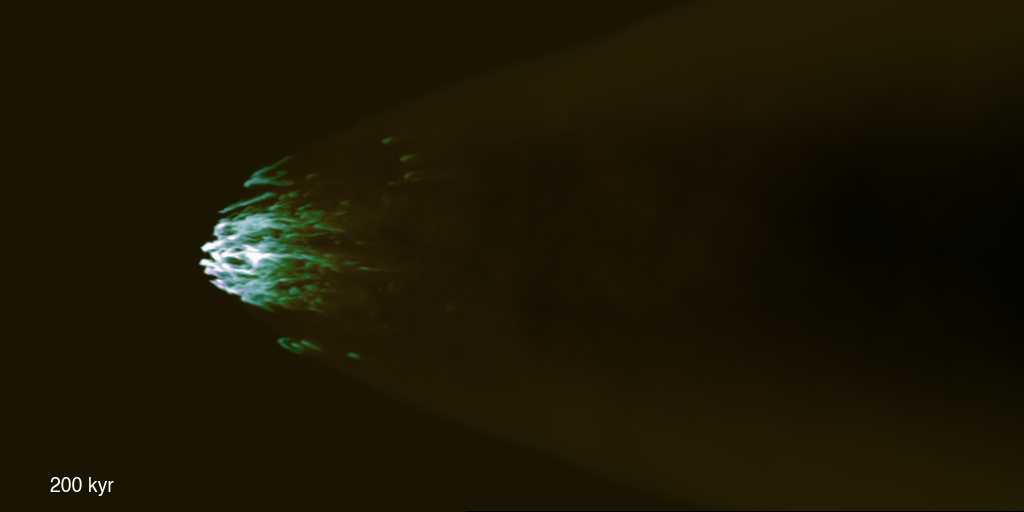
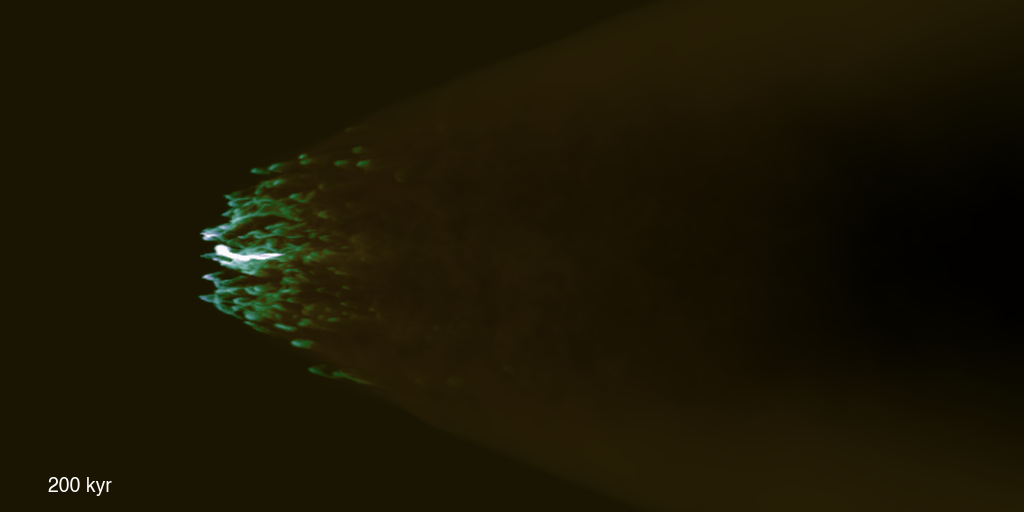
Snapshots of the three simulations clouds at 200 kyr (low res followed by high res with the old
density profile followed by high res with the new density profile):

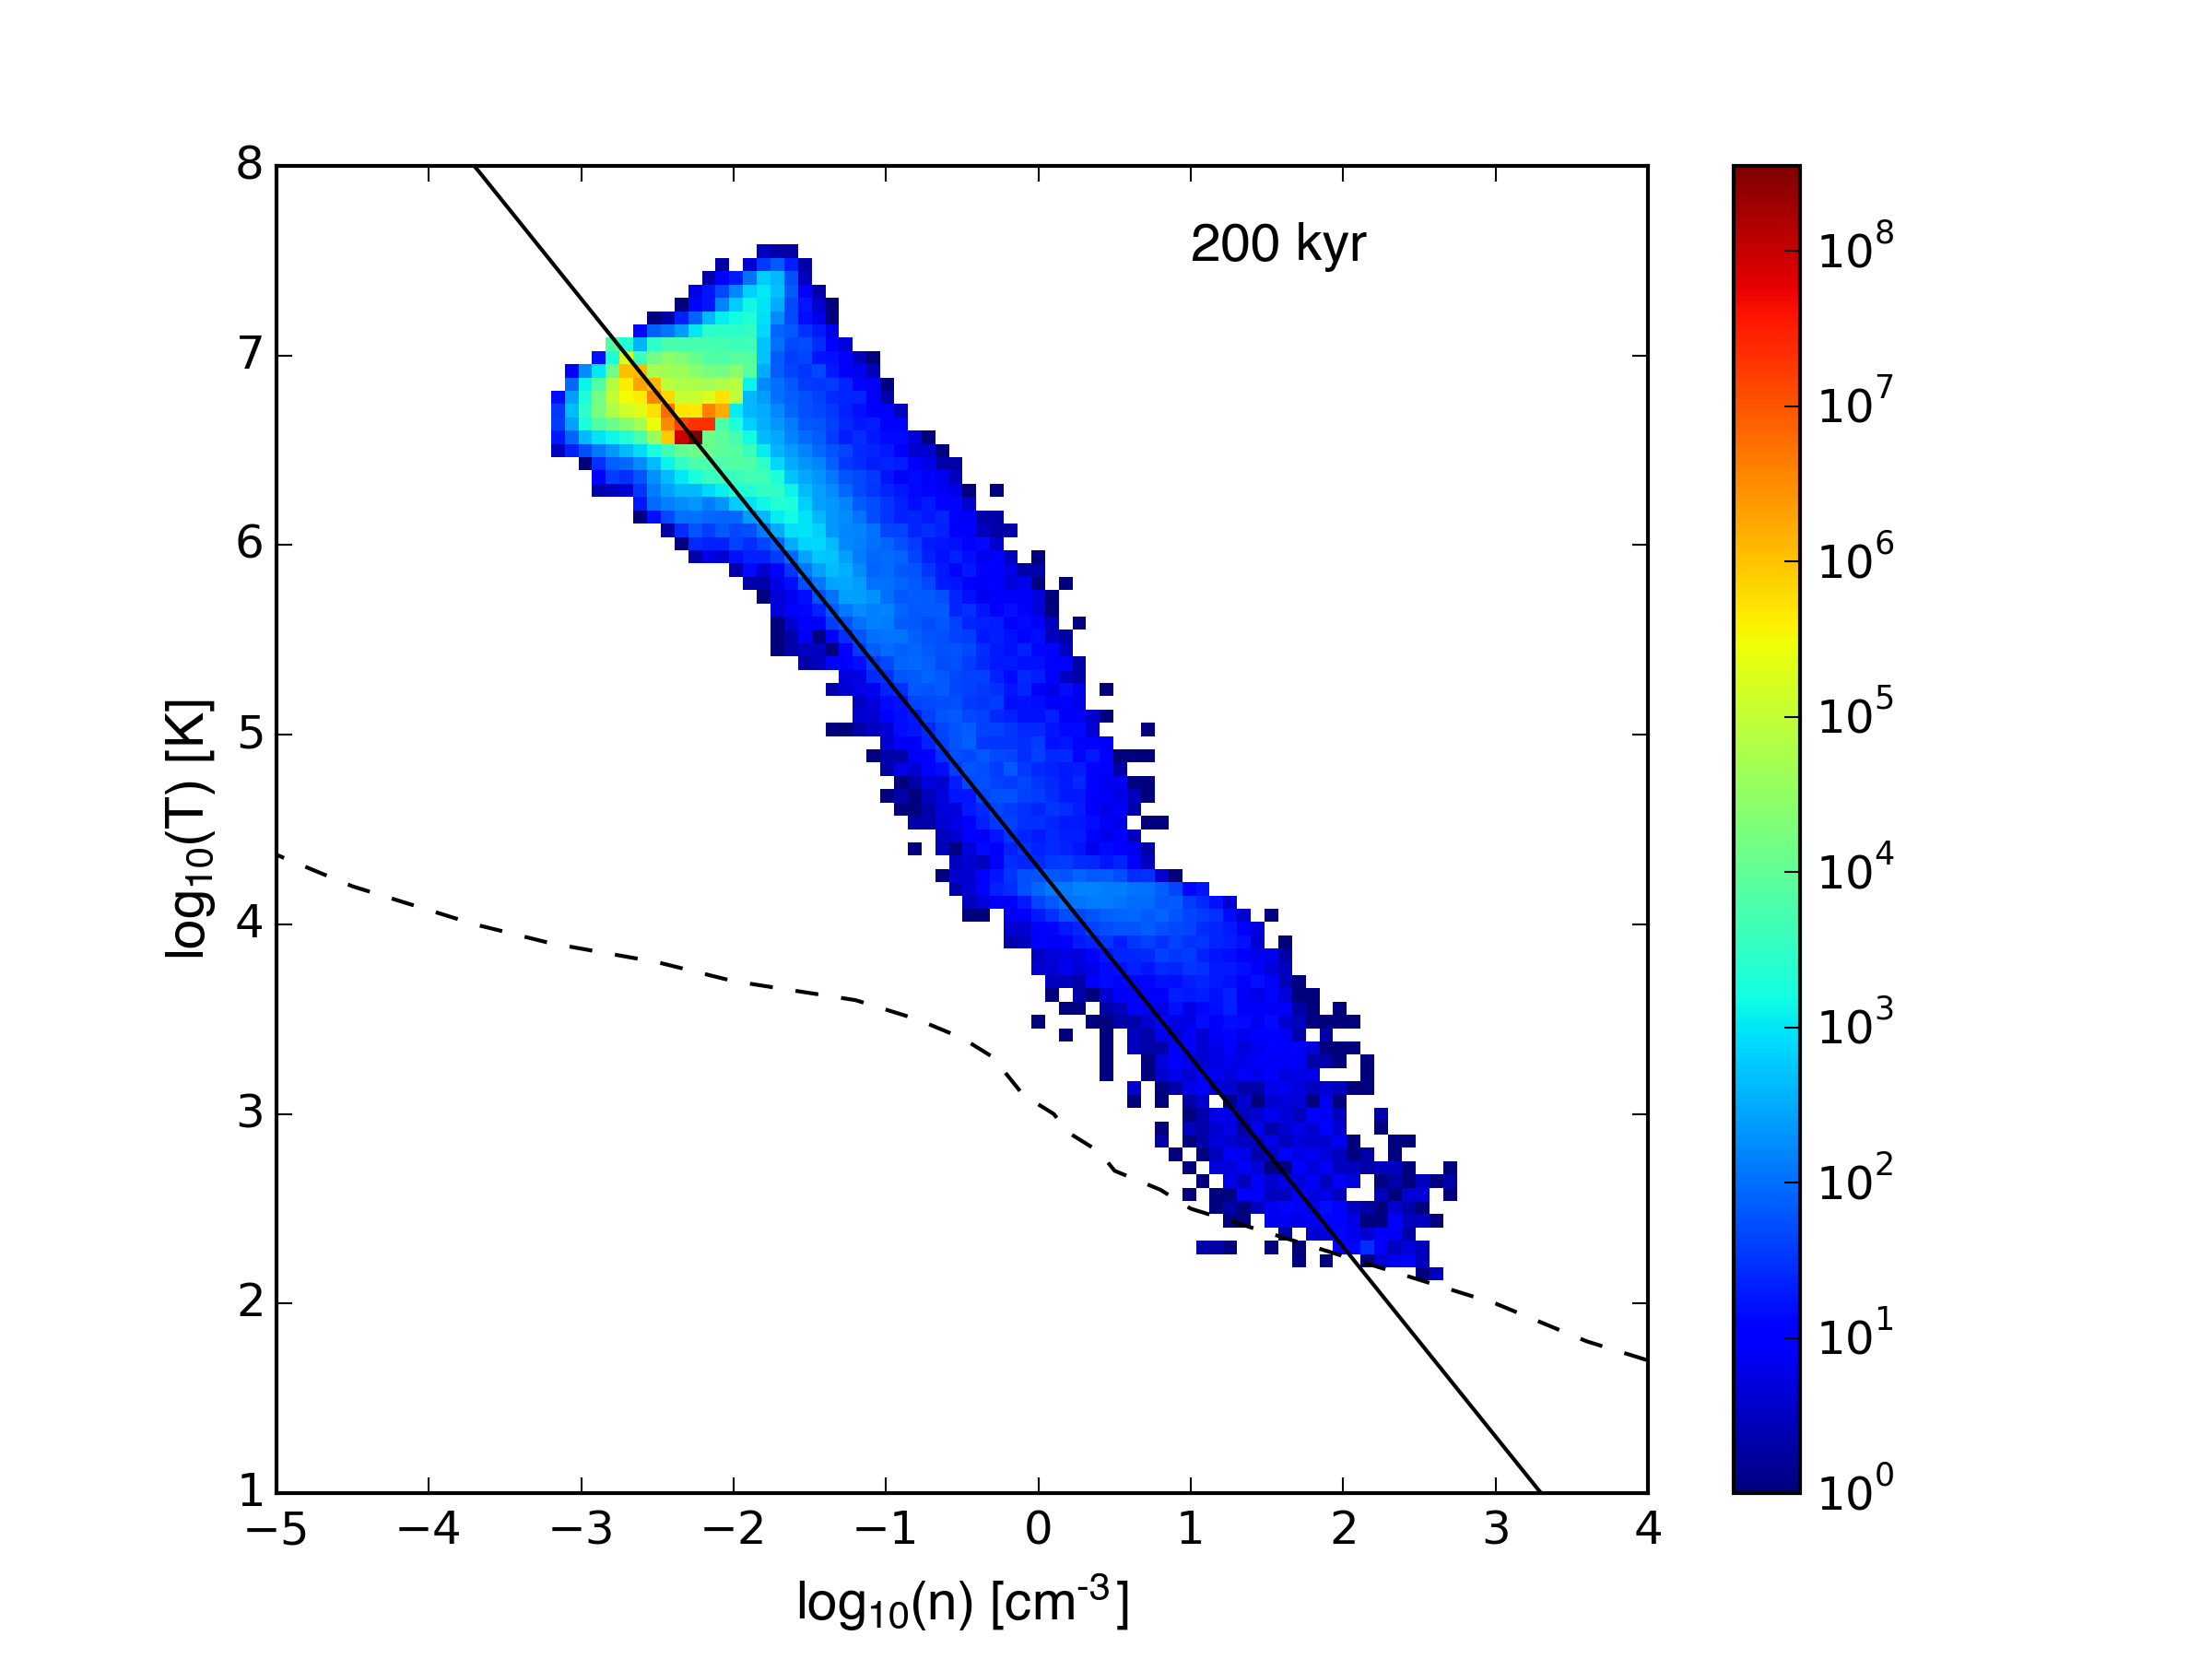
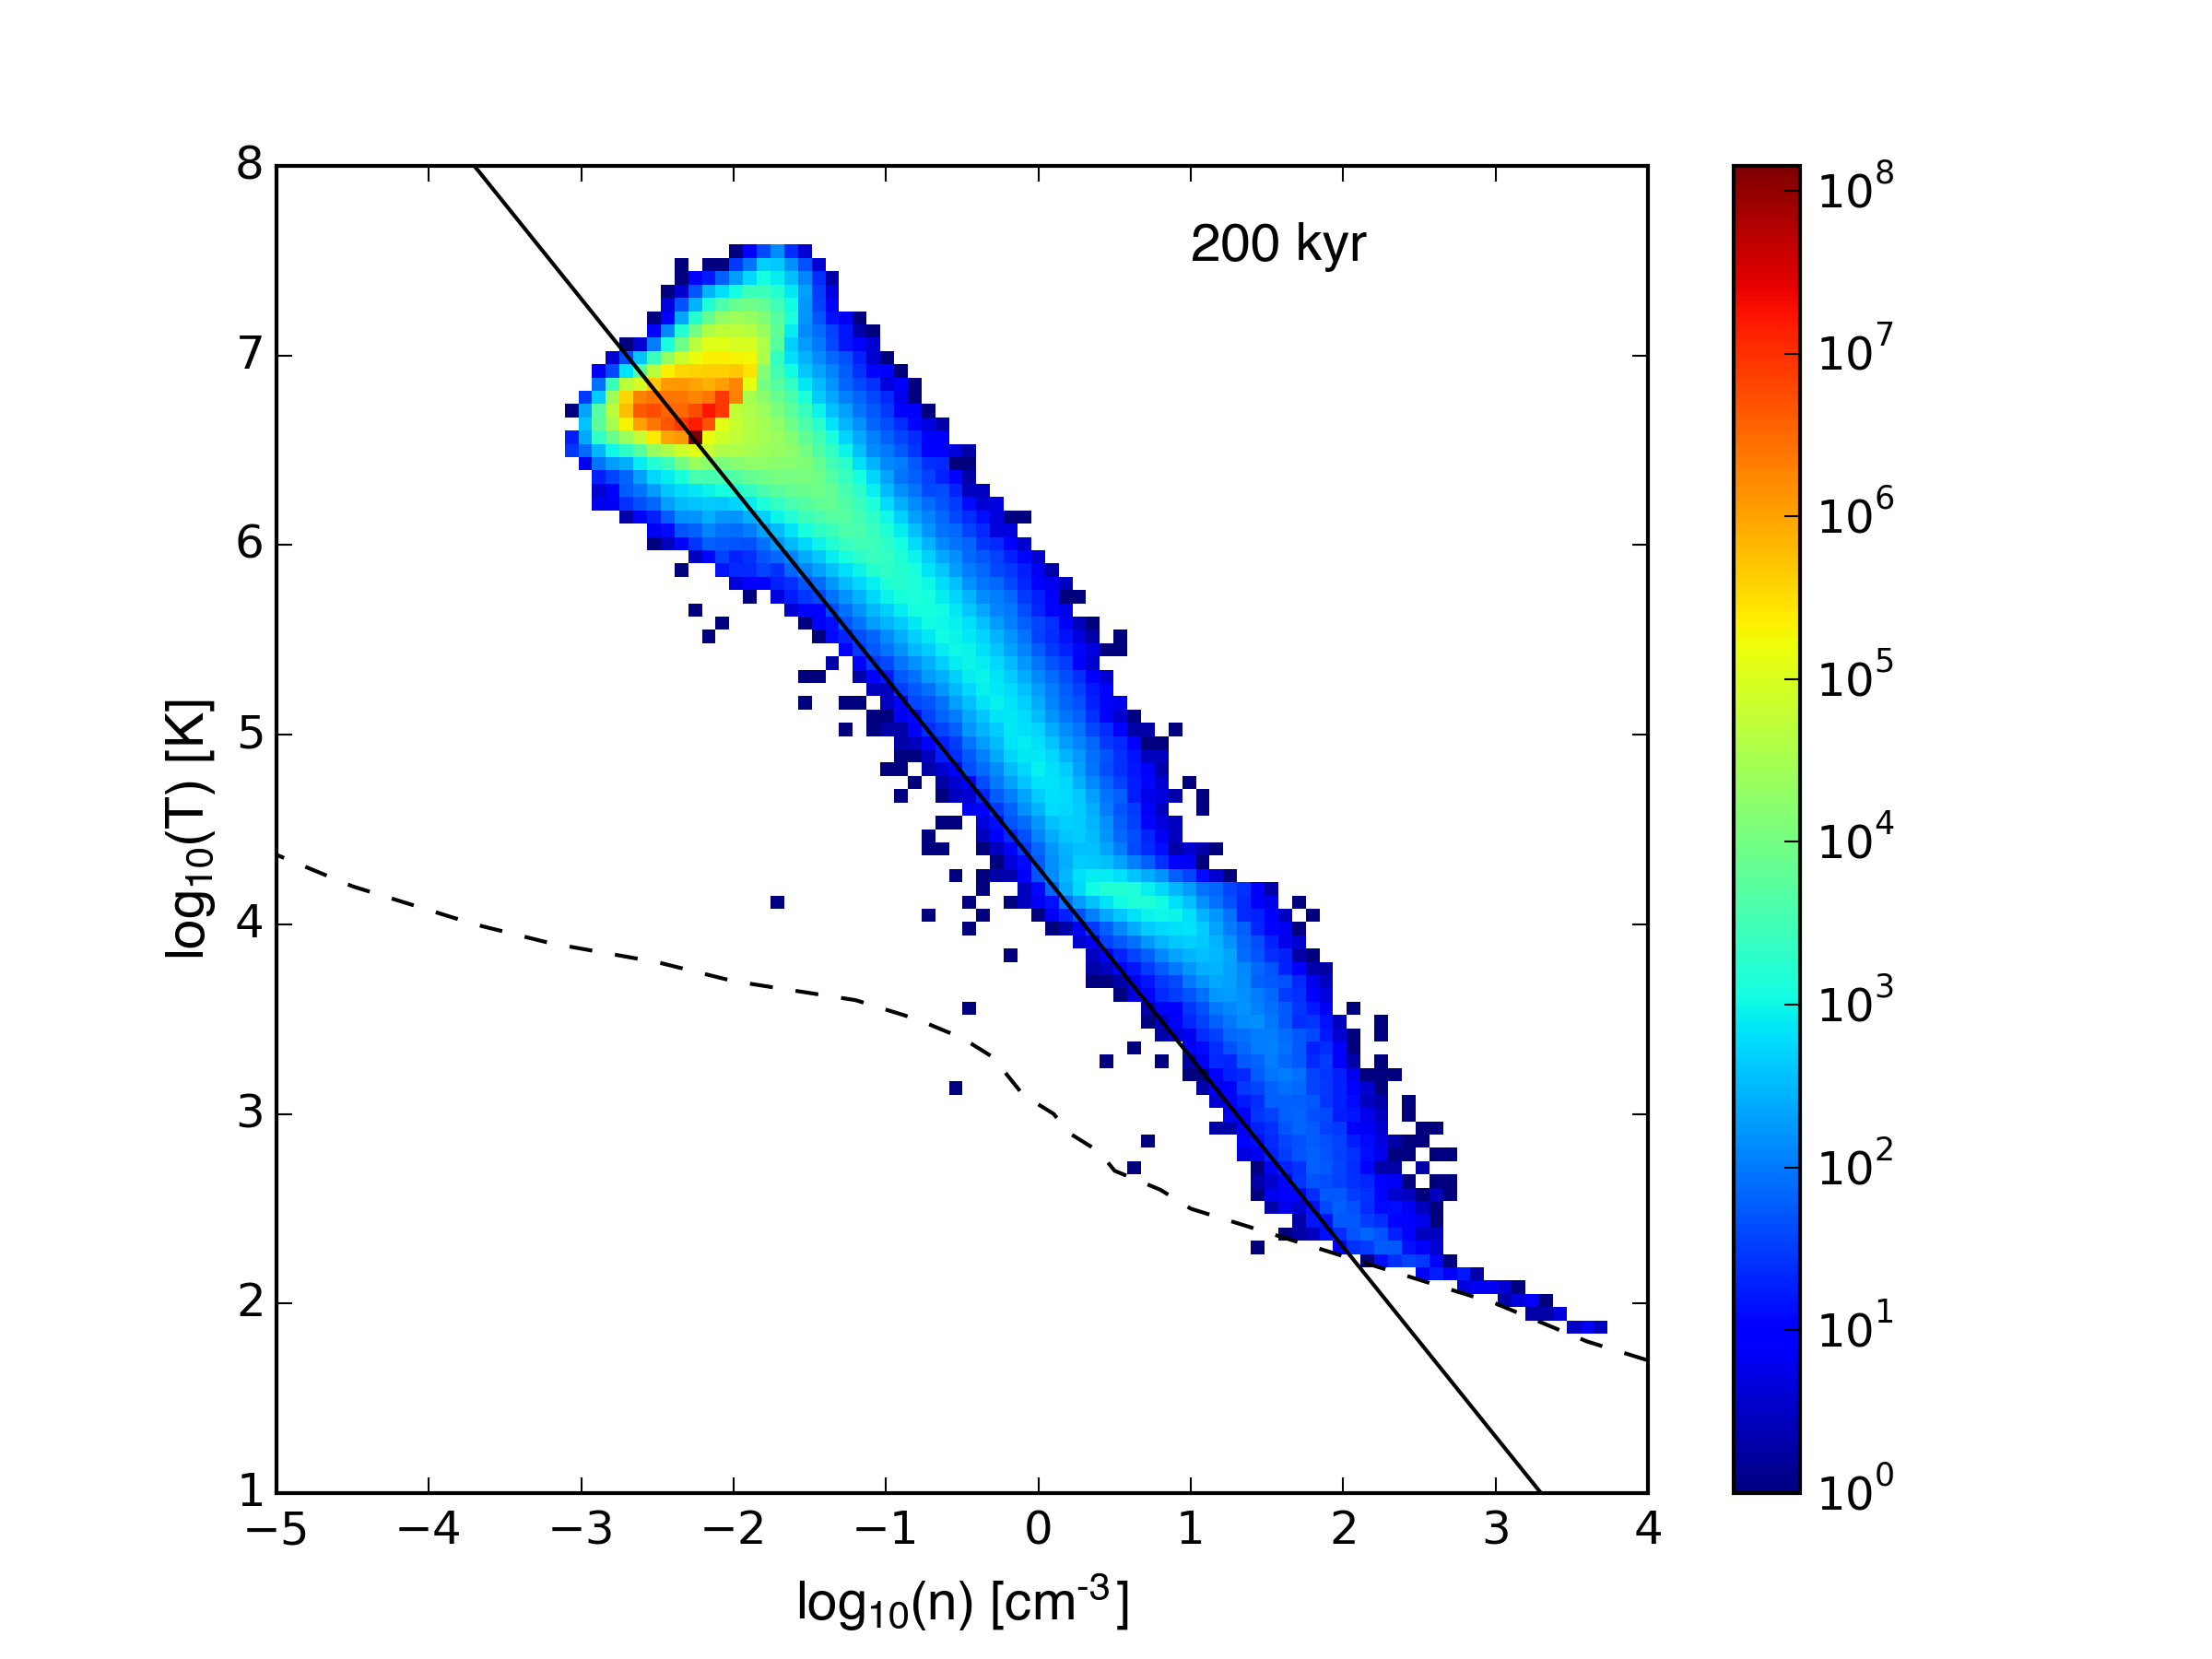
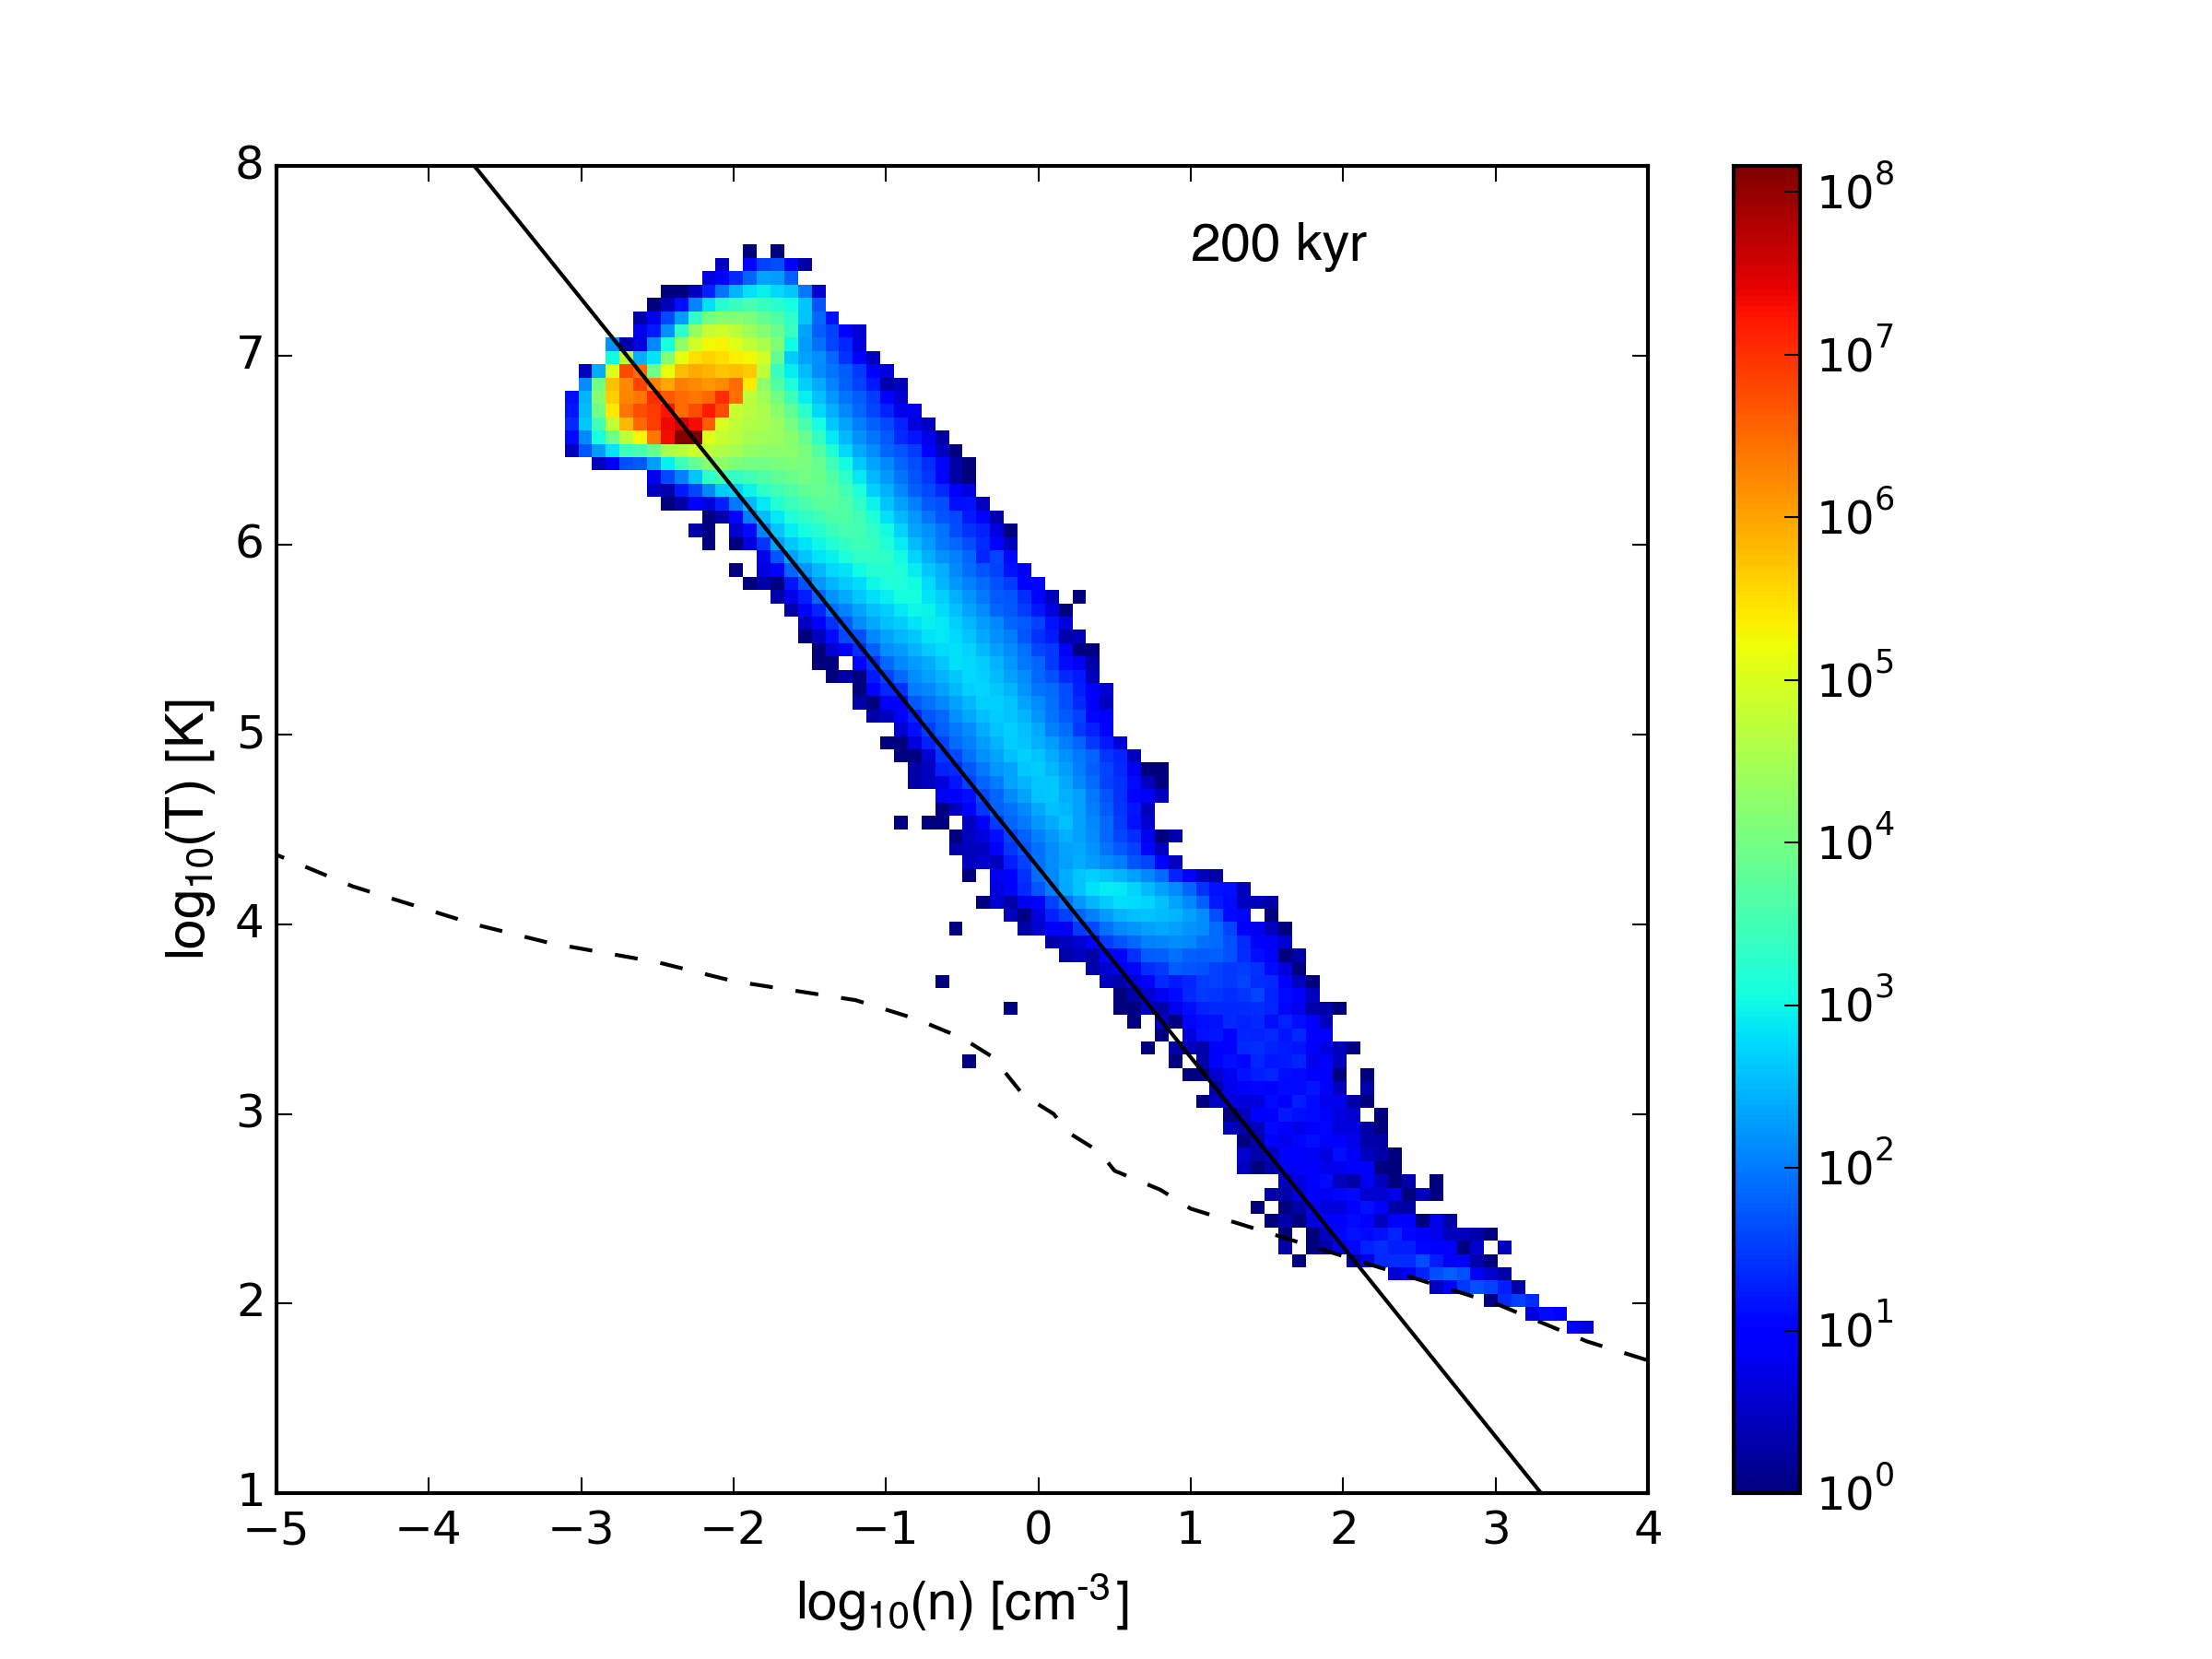
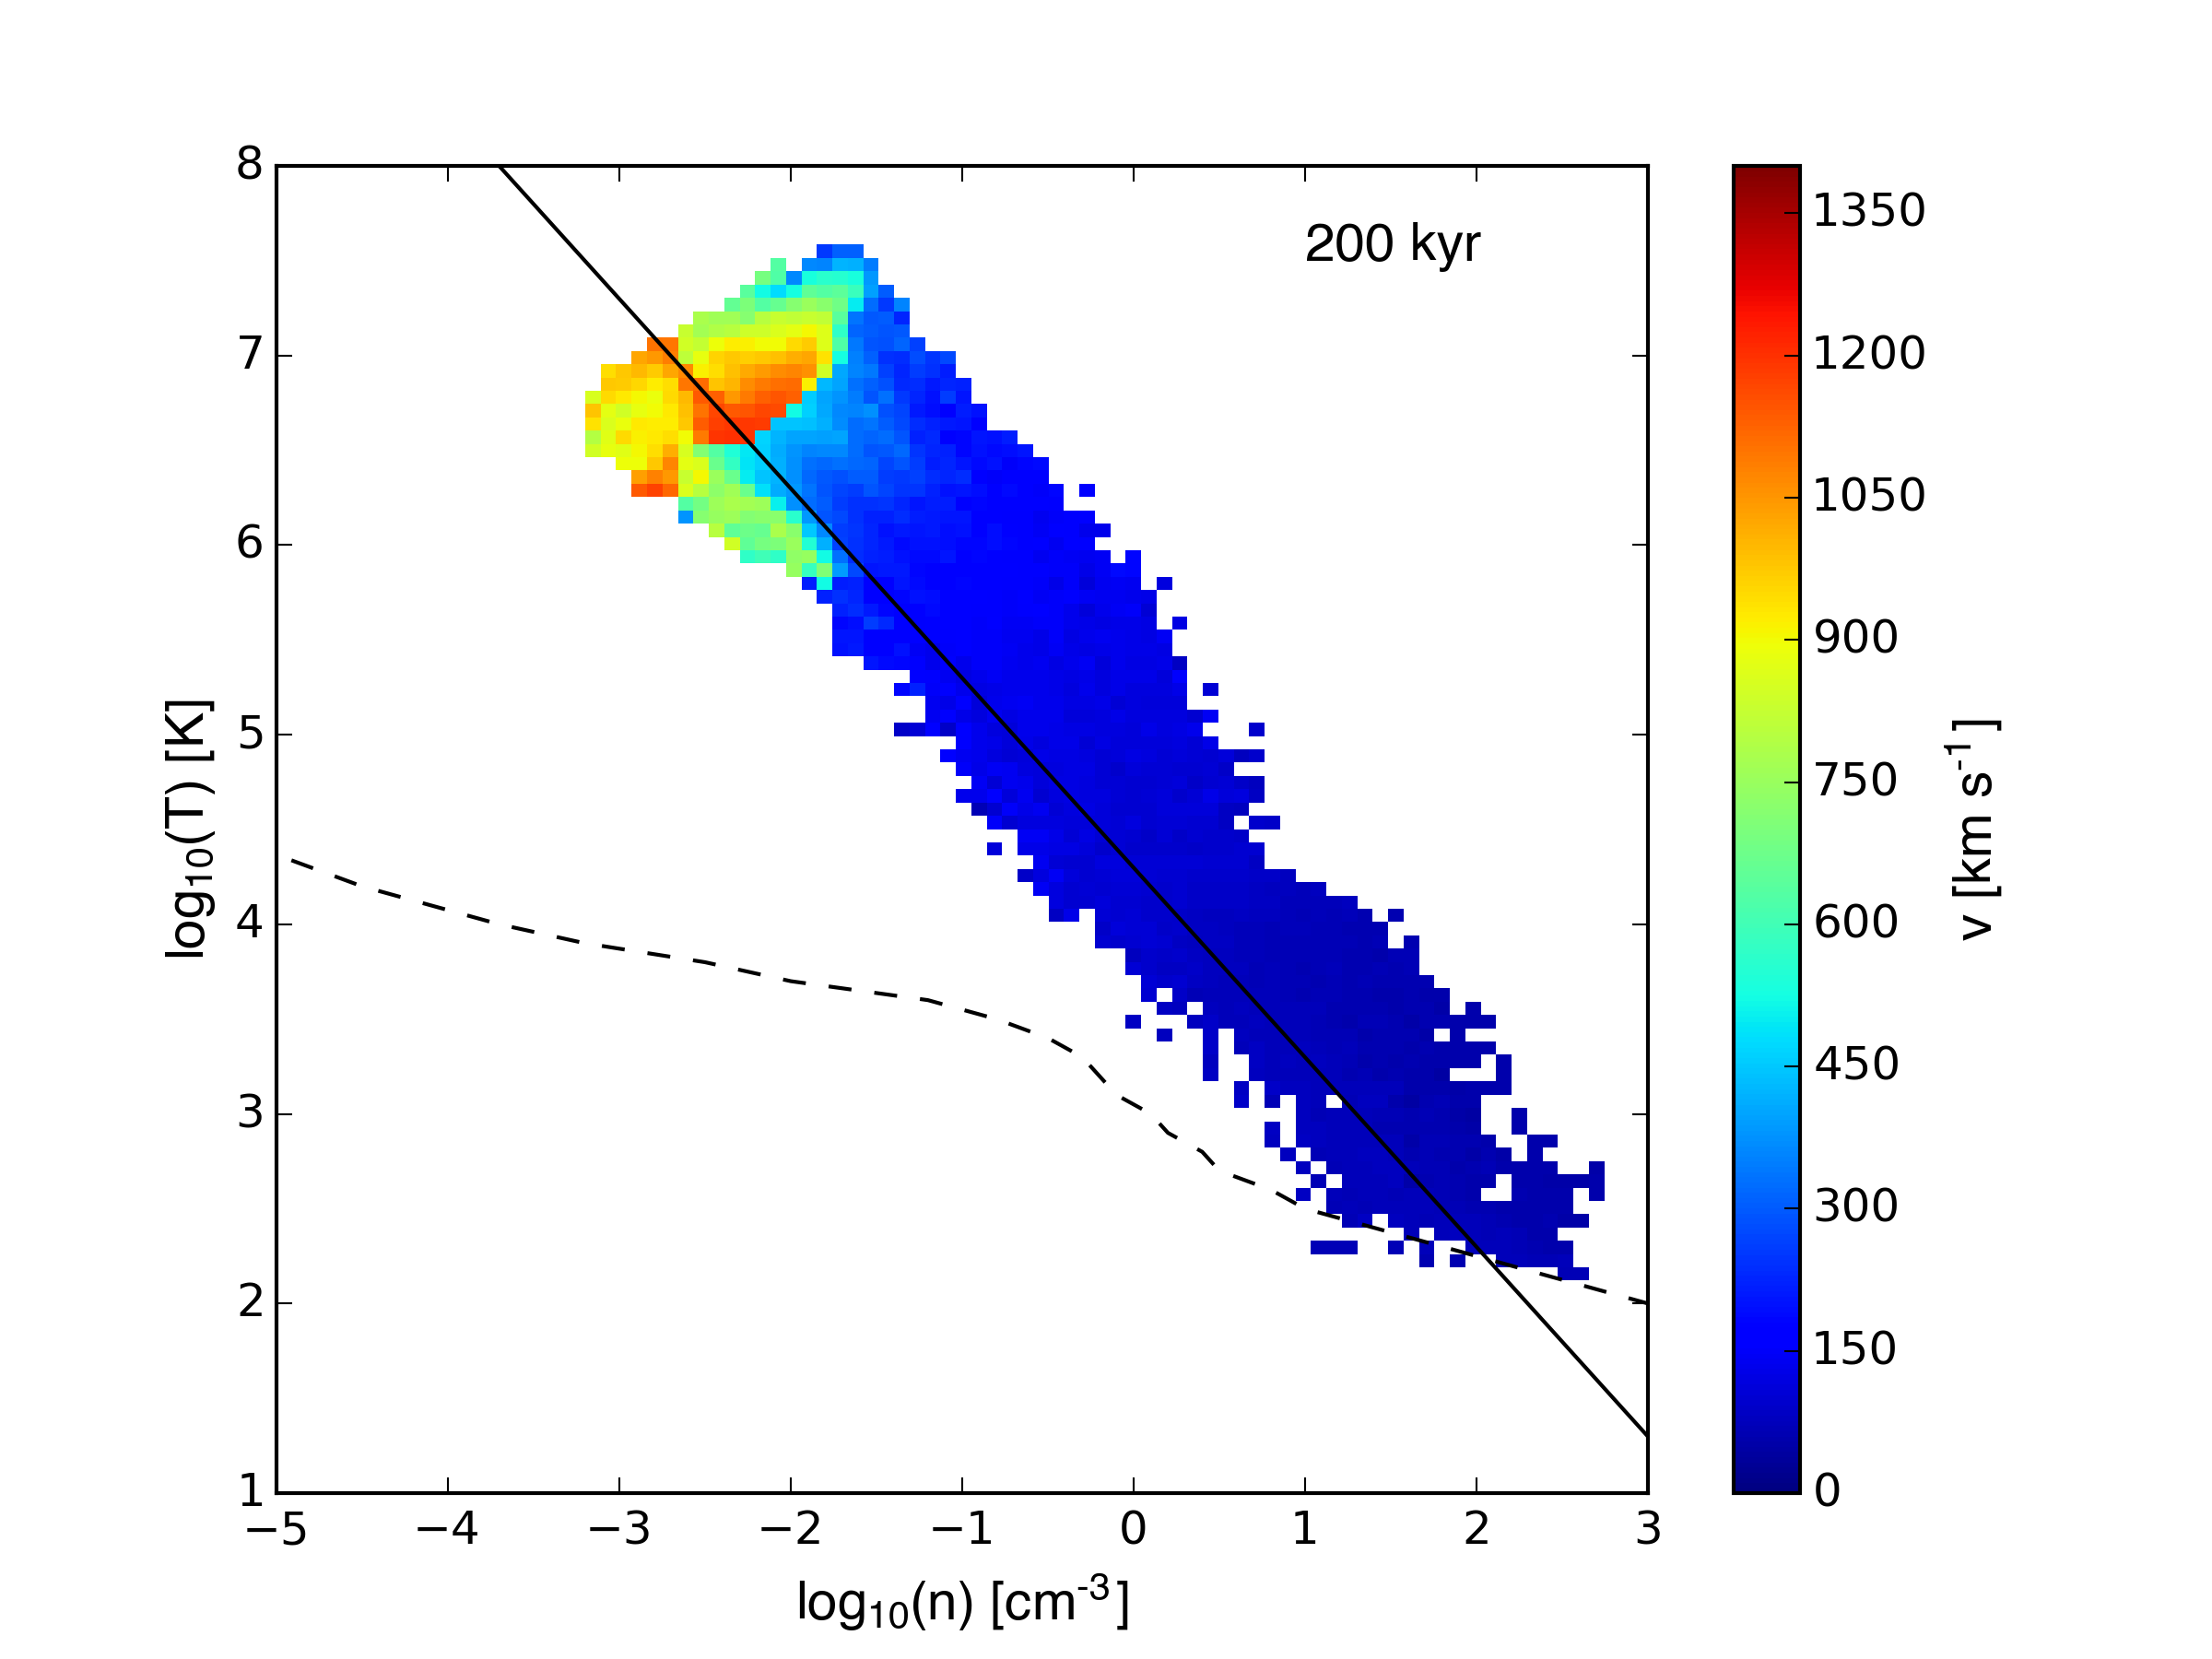
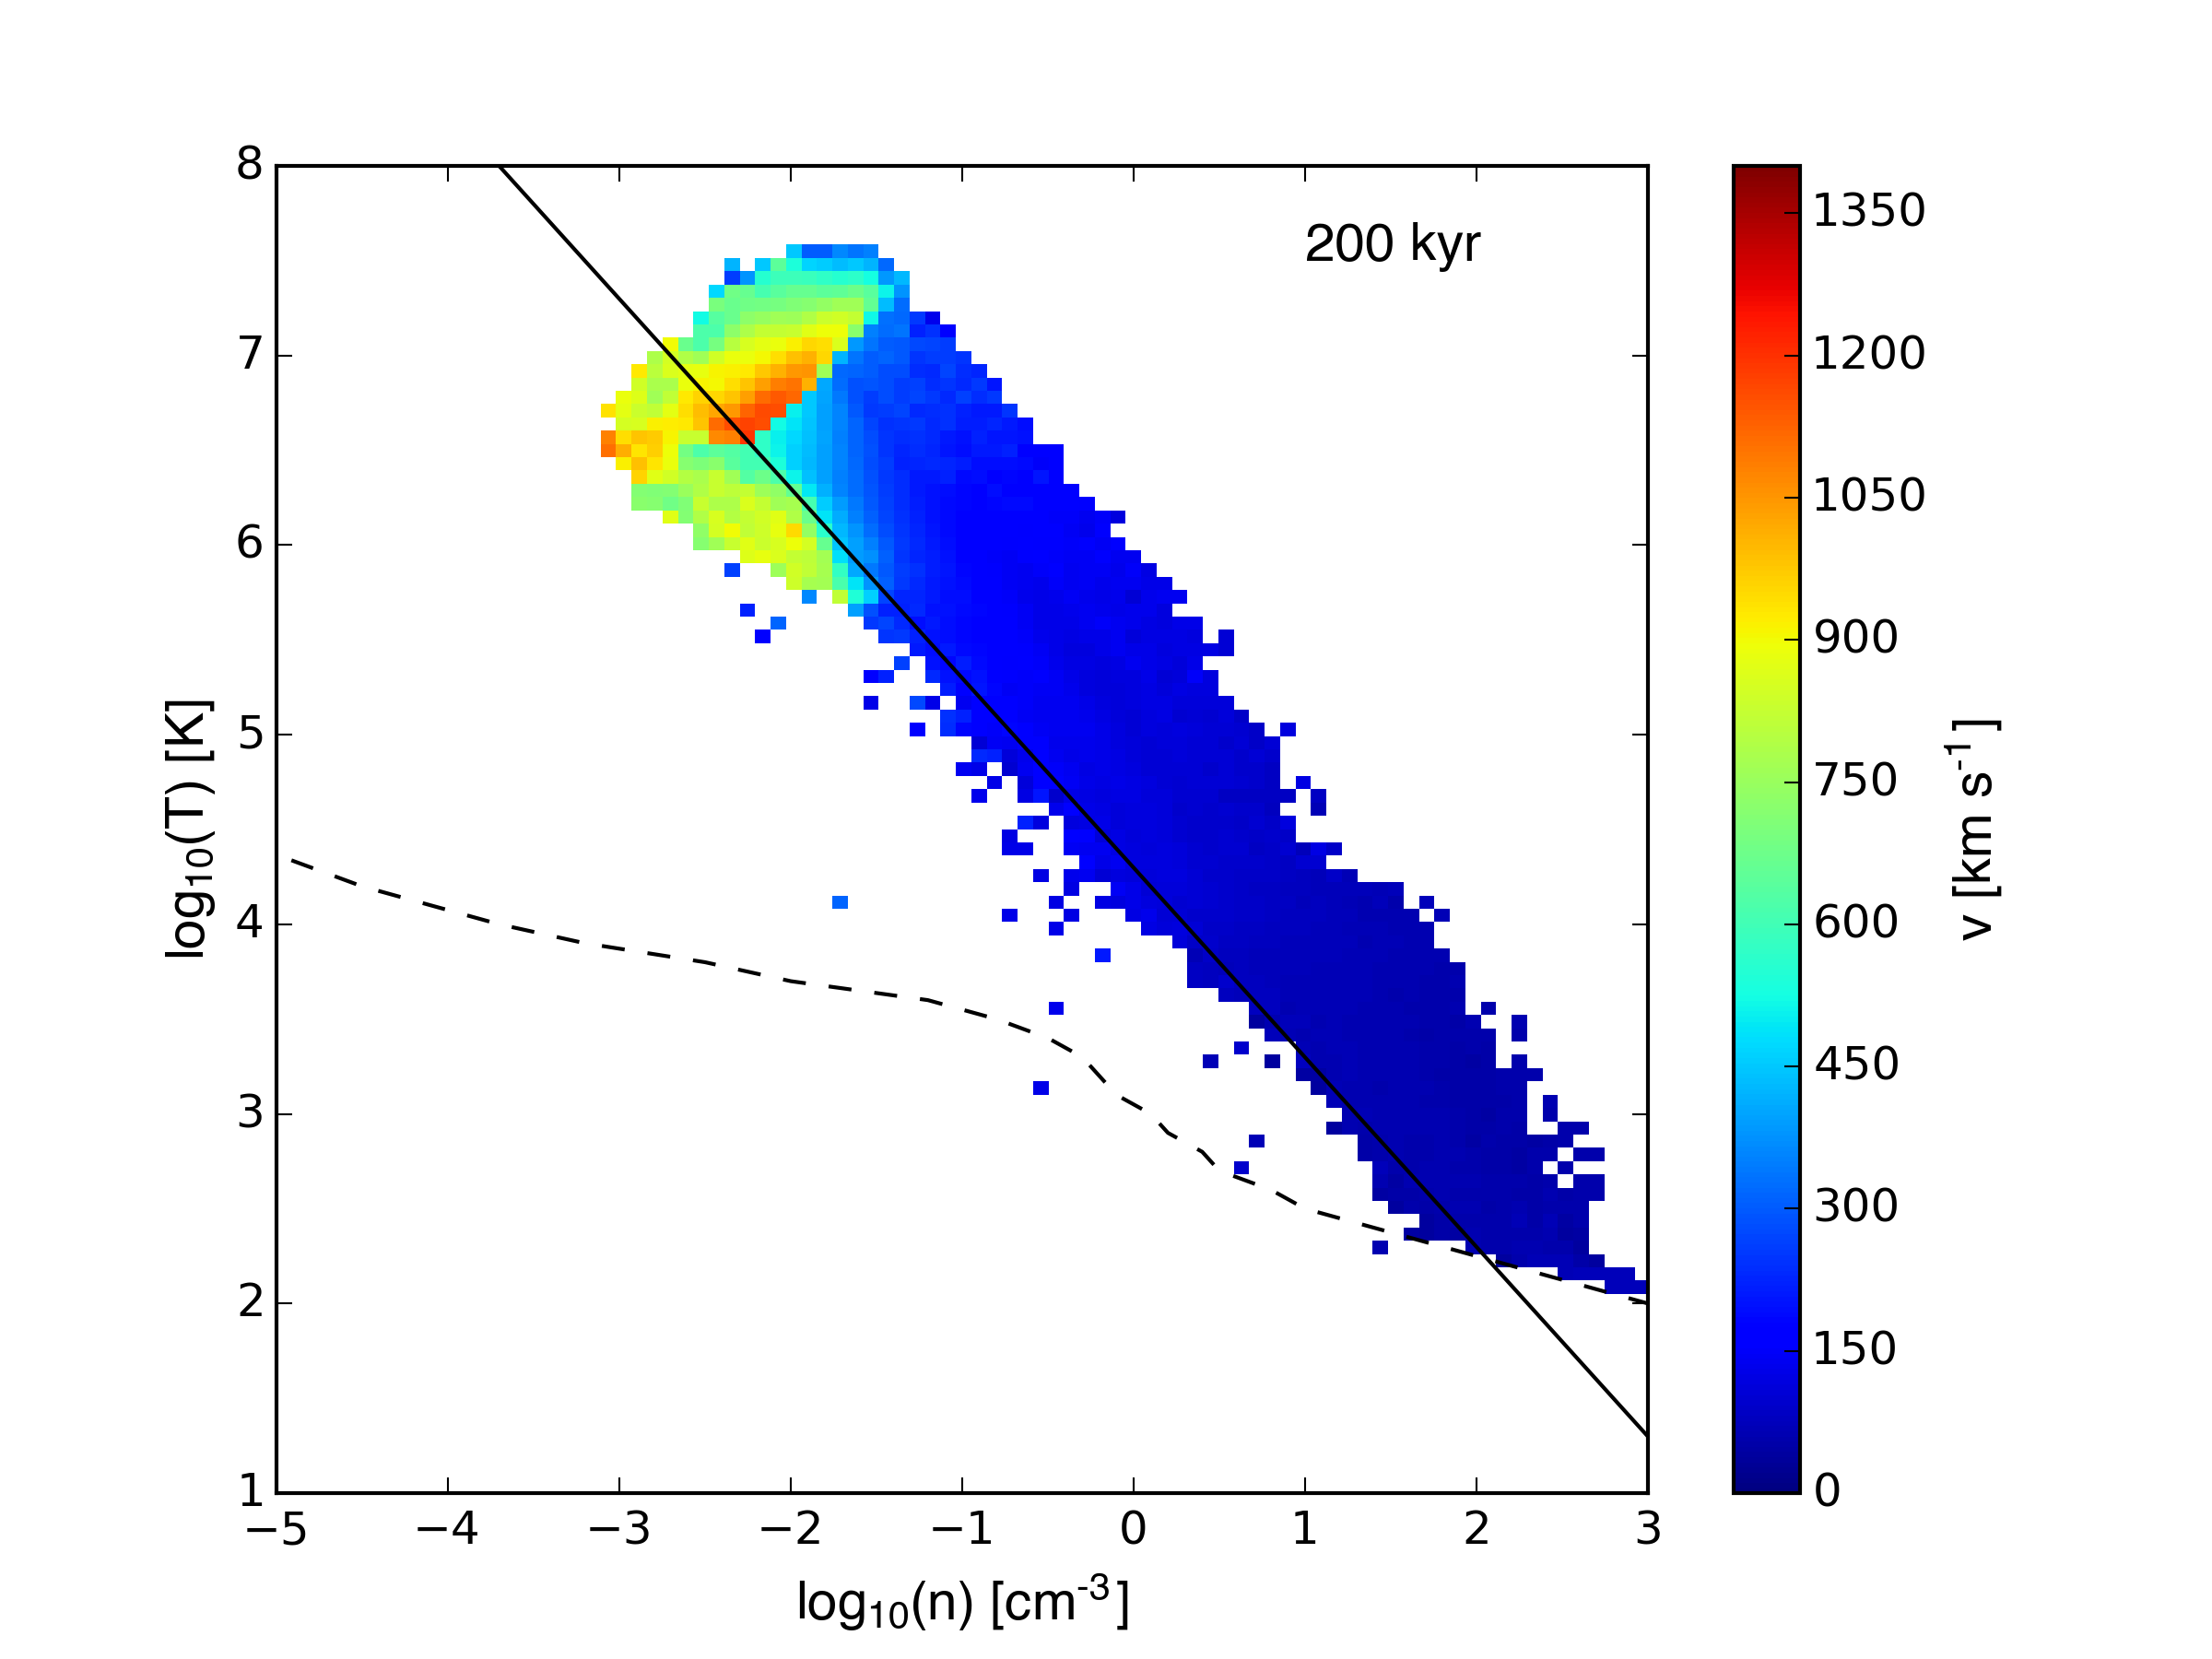
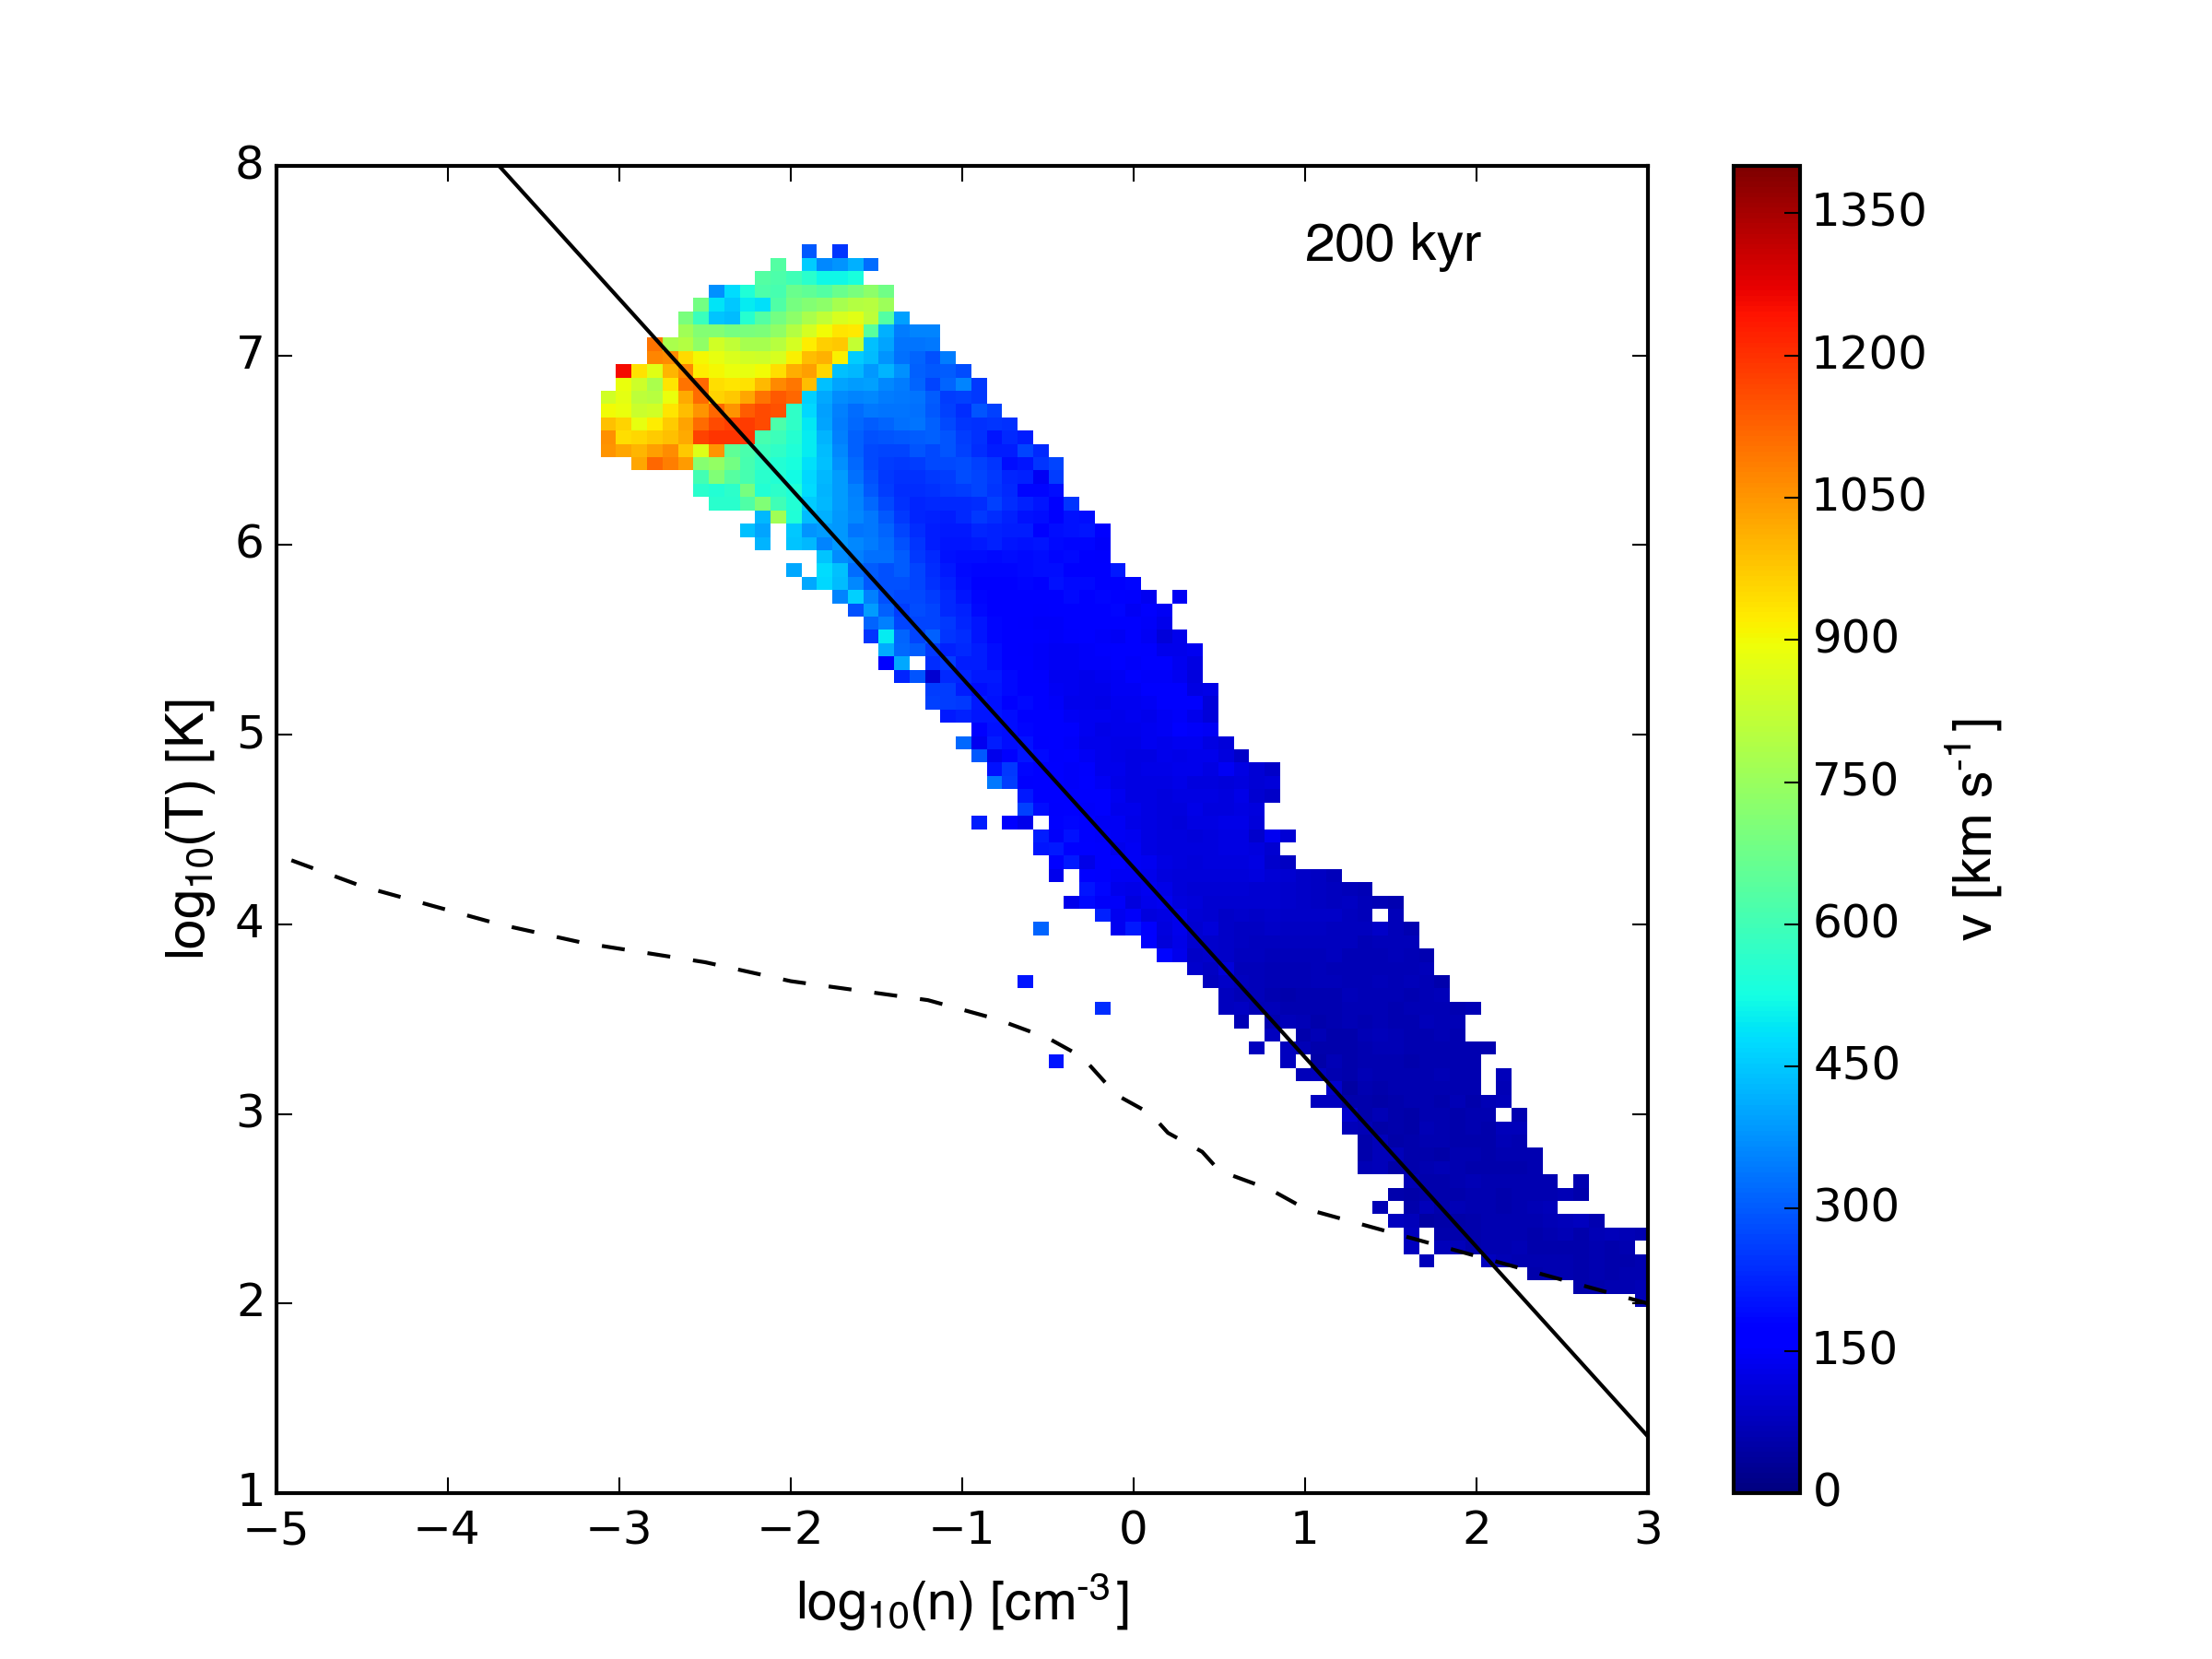
Density-temperature plots (low res followed by high res with the old
density profile followed by high res with the new density profile):
Velocity-weighted density-temperature plots:
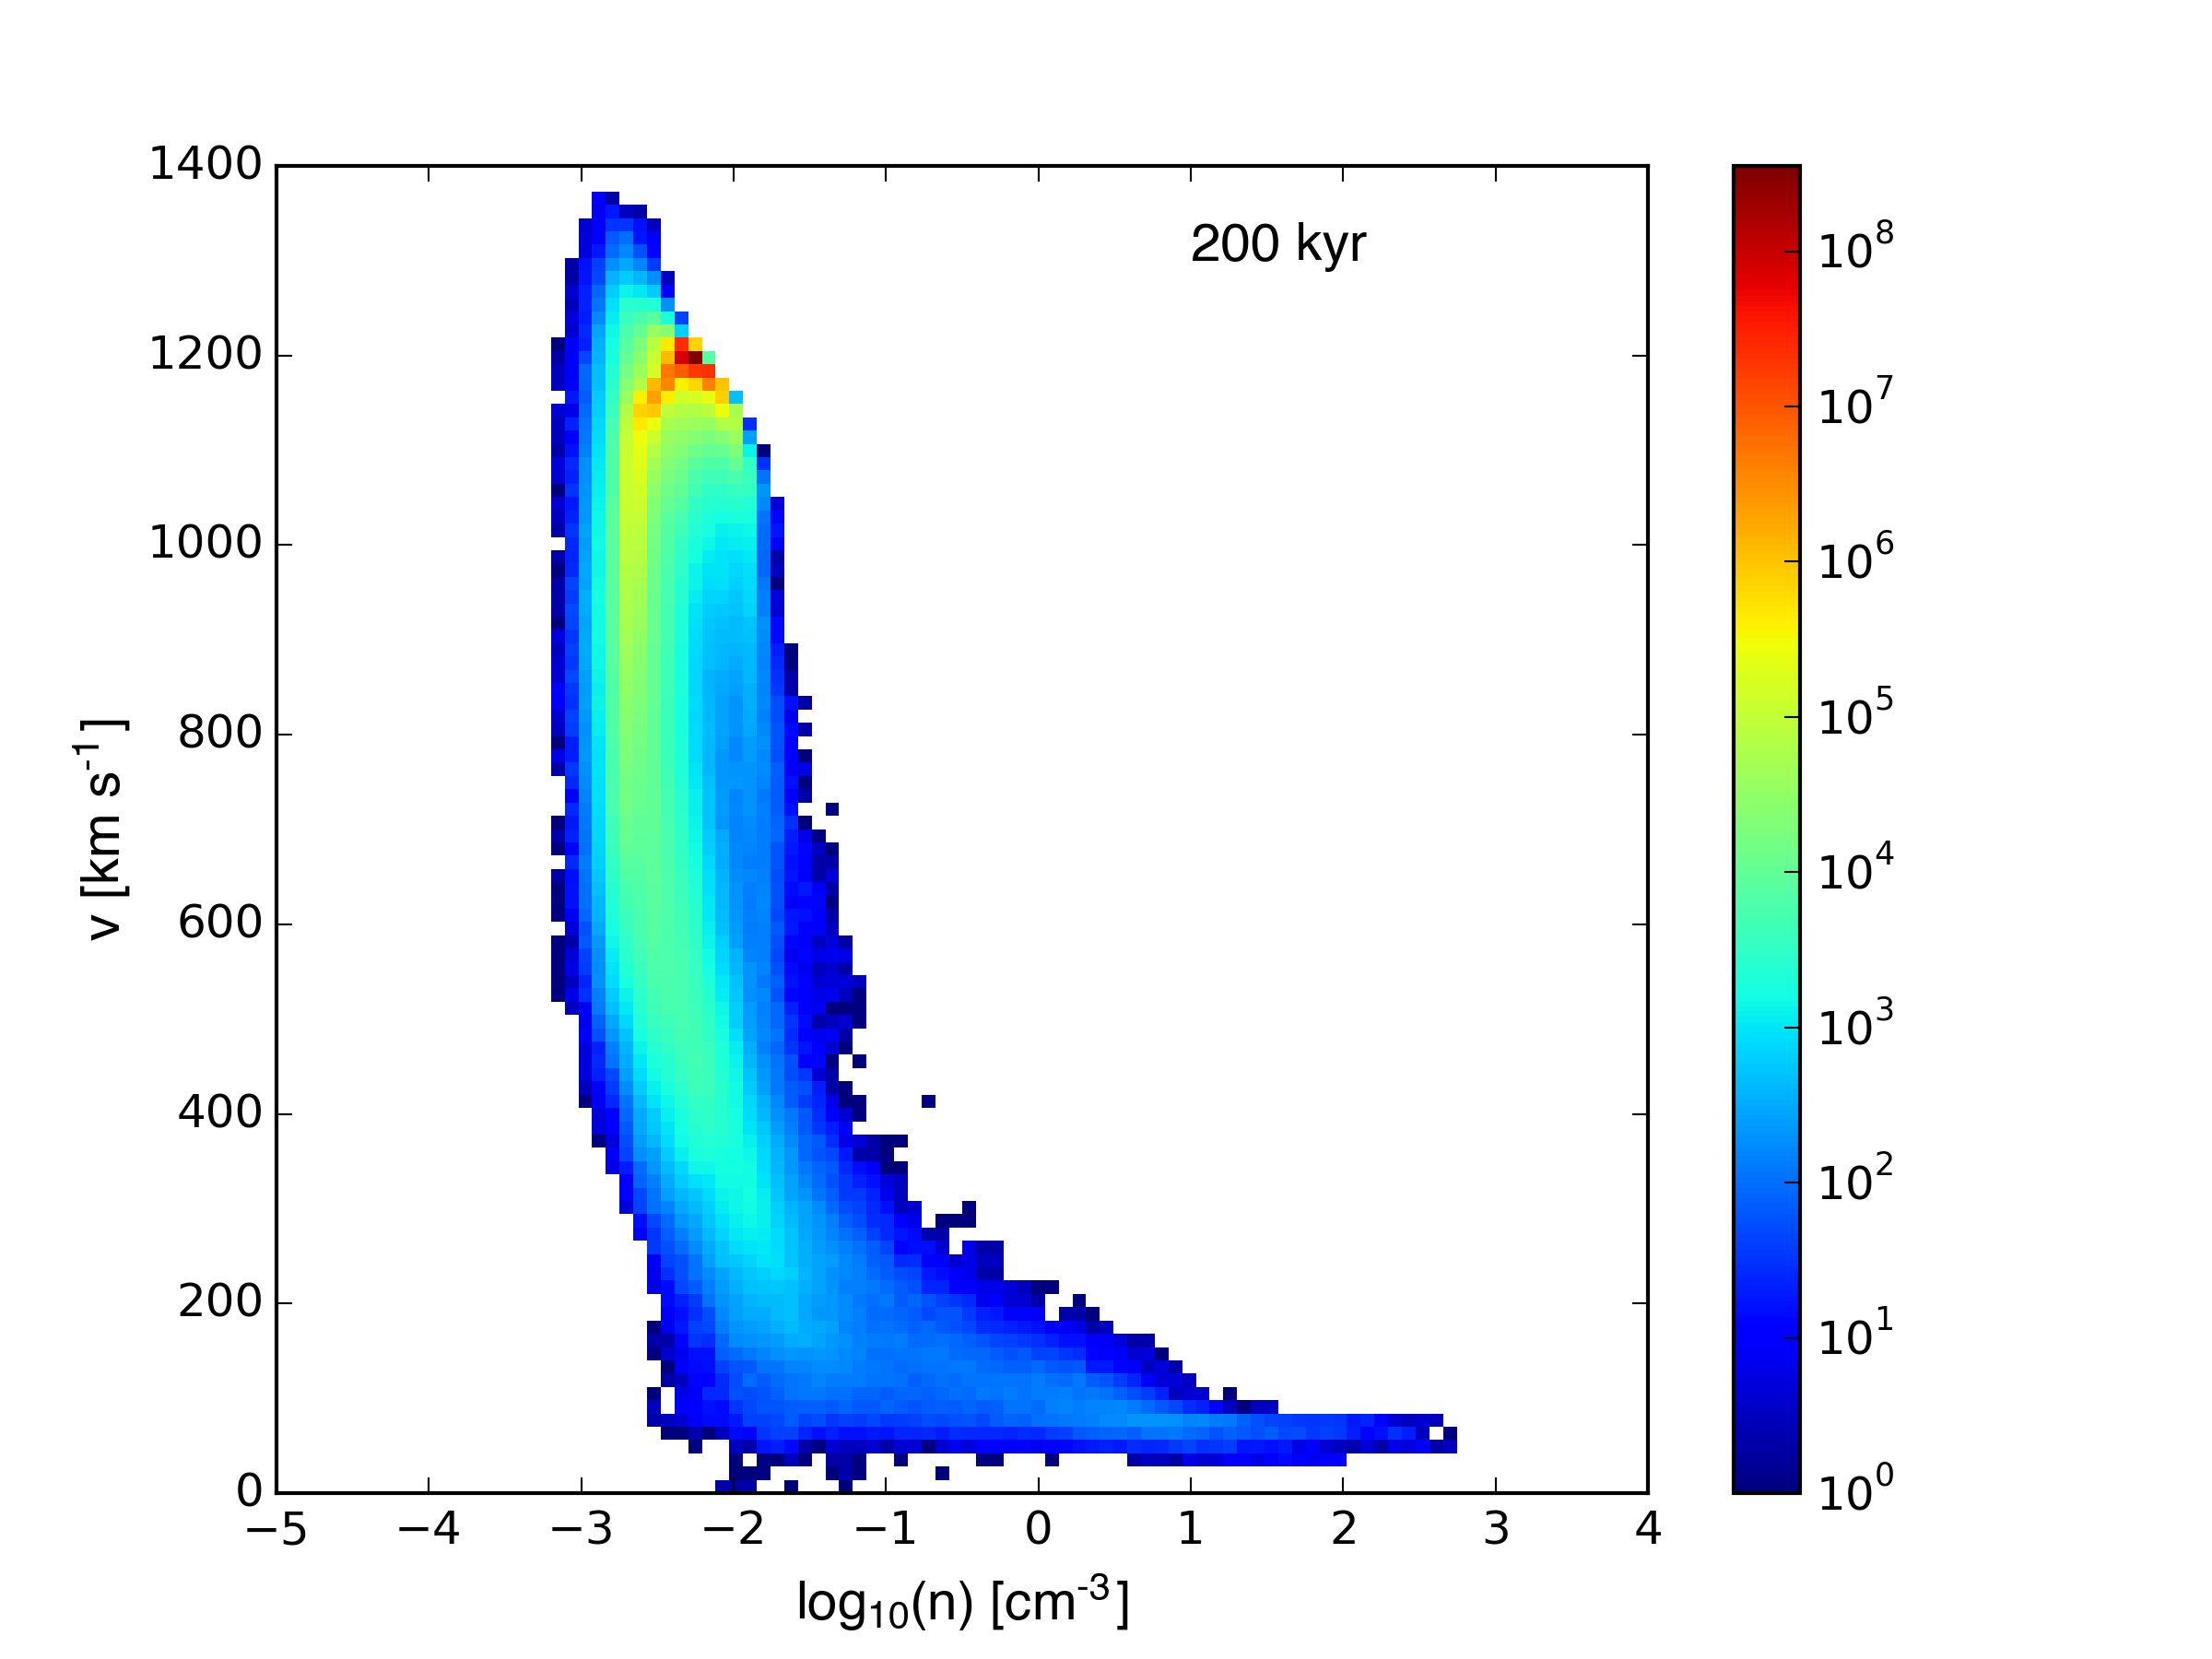
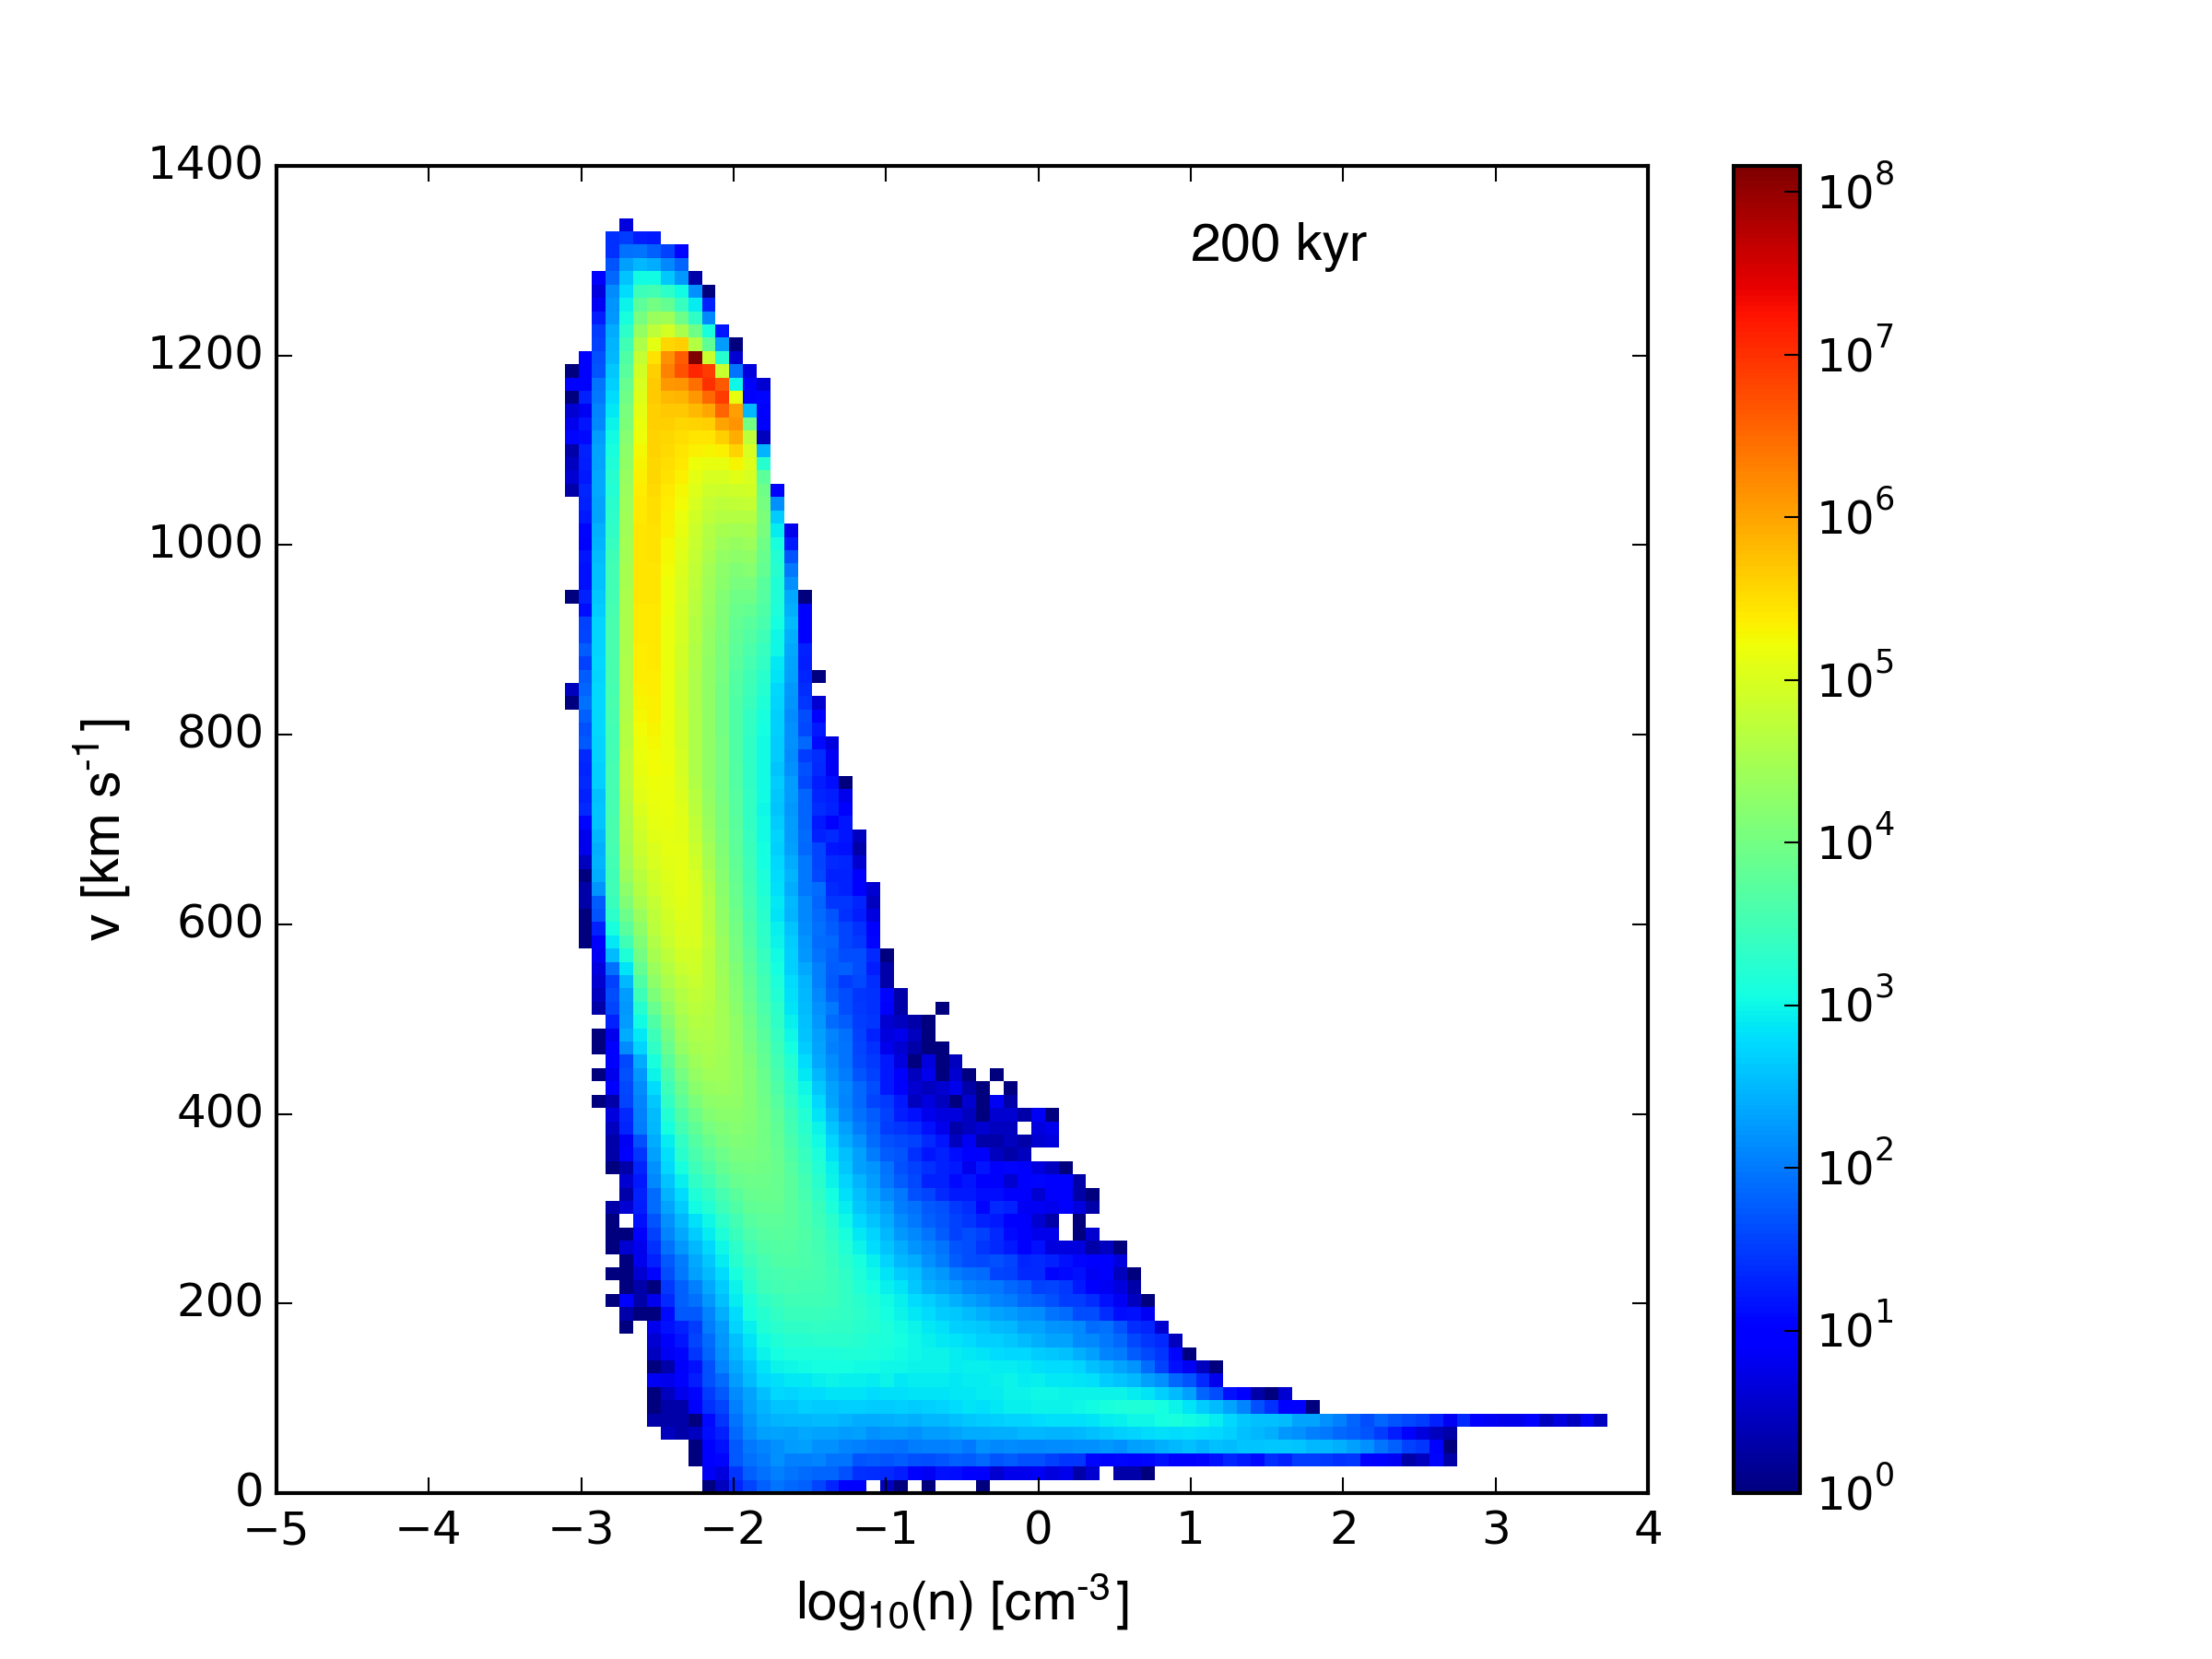
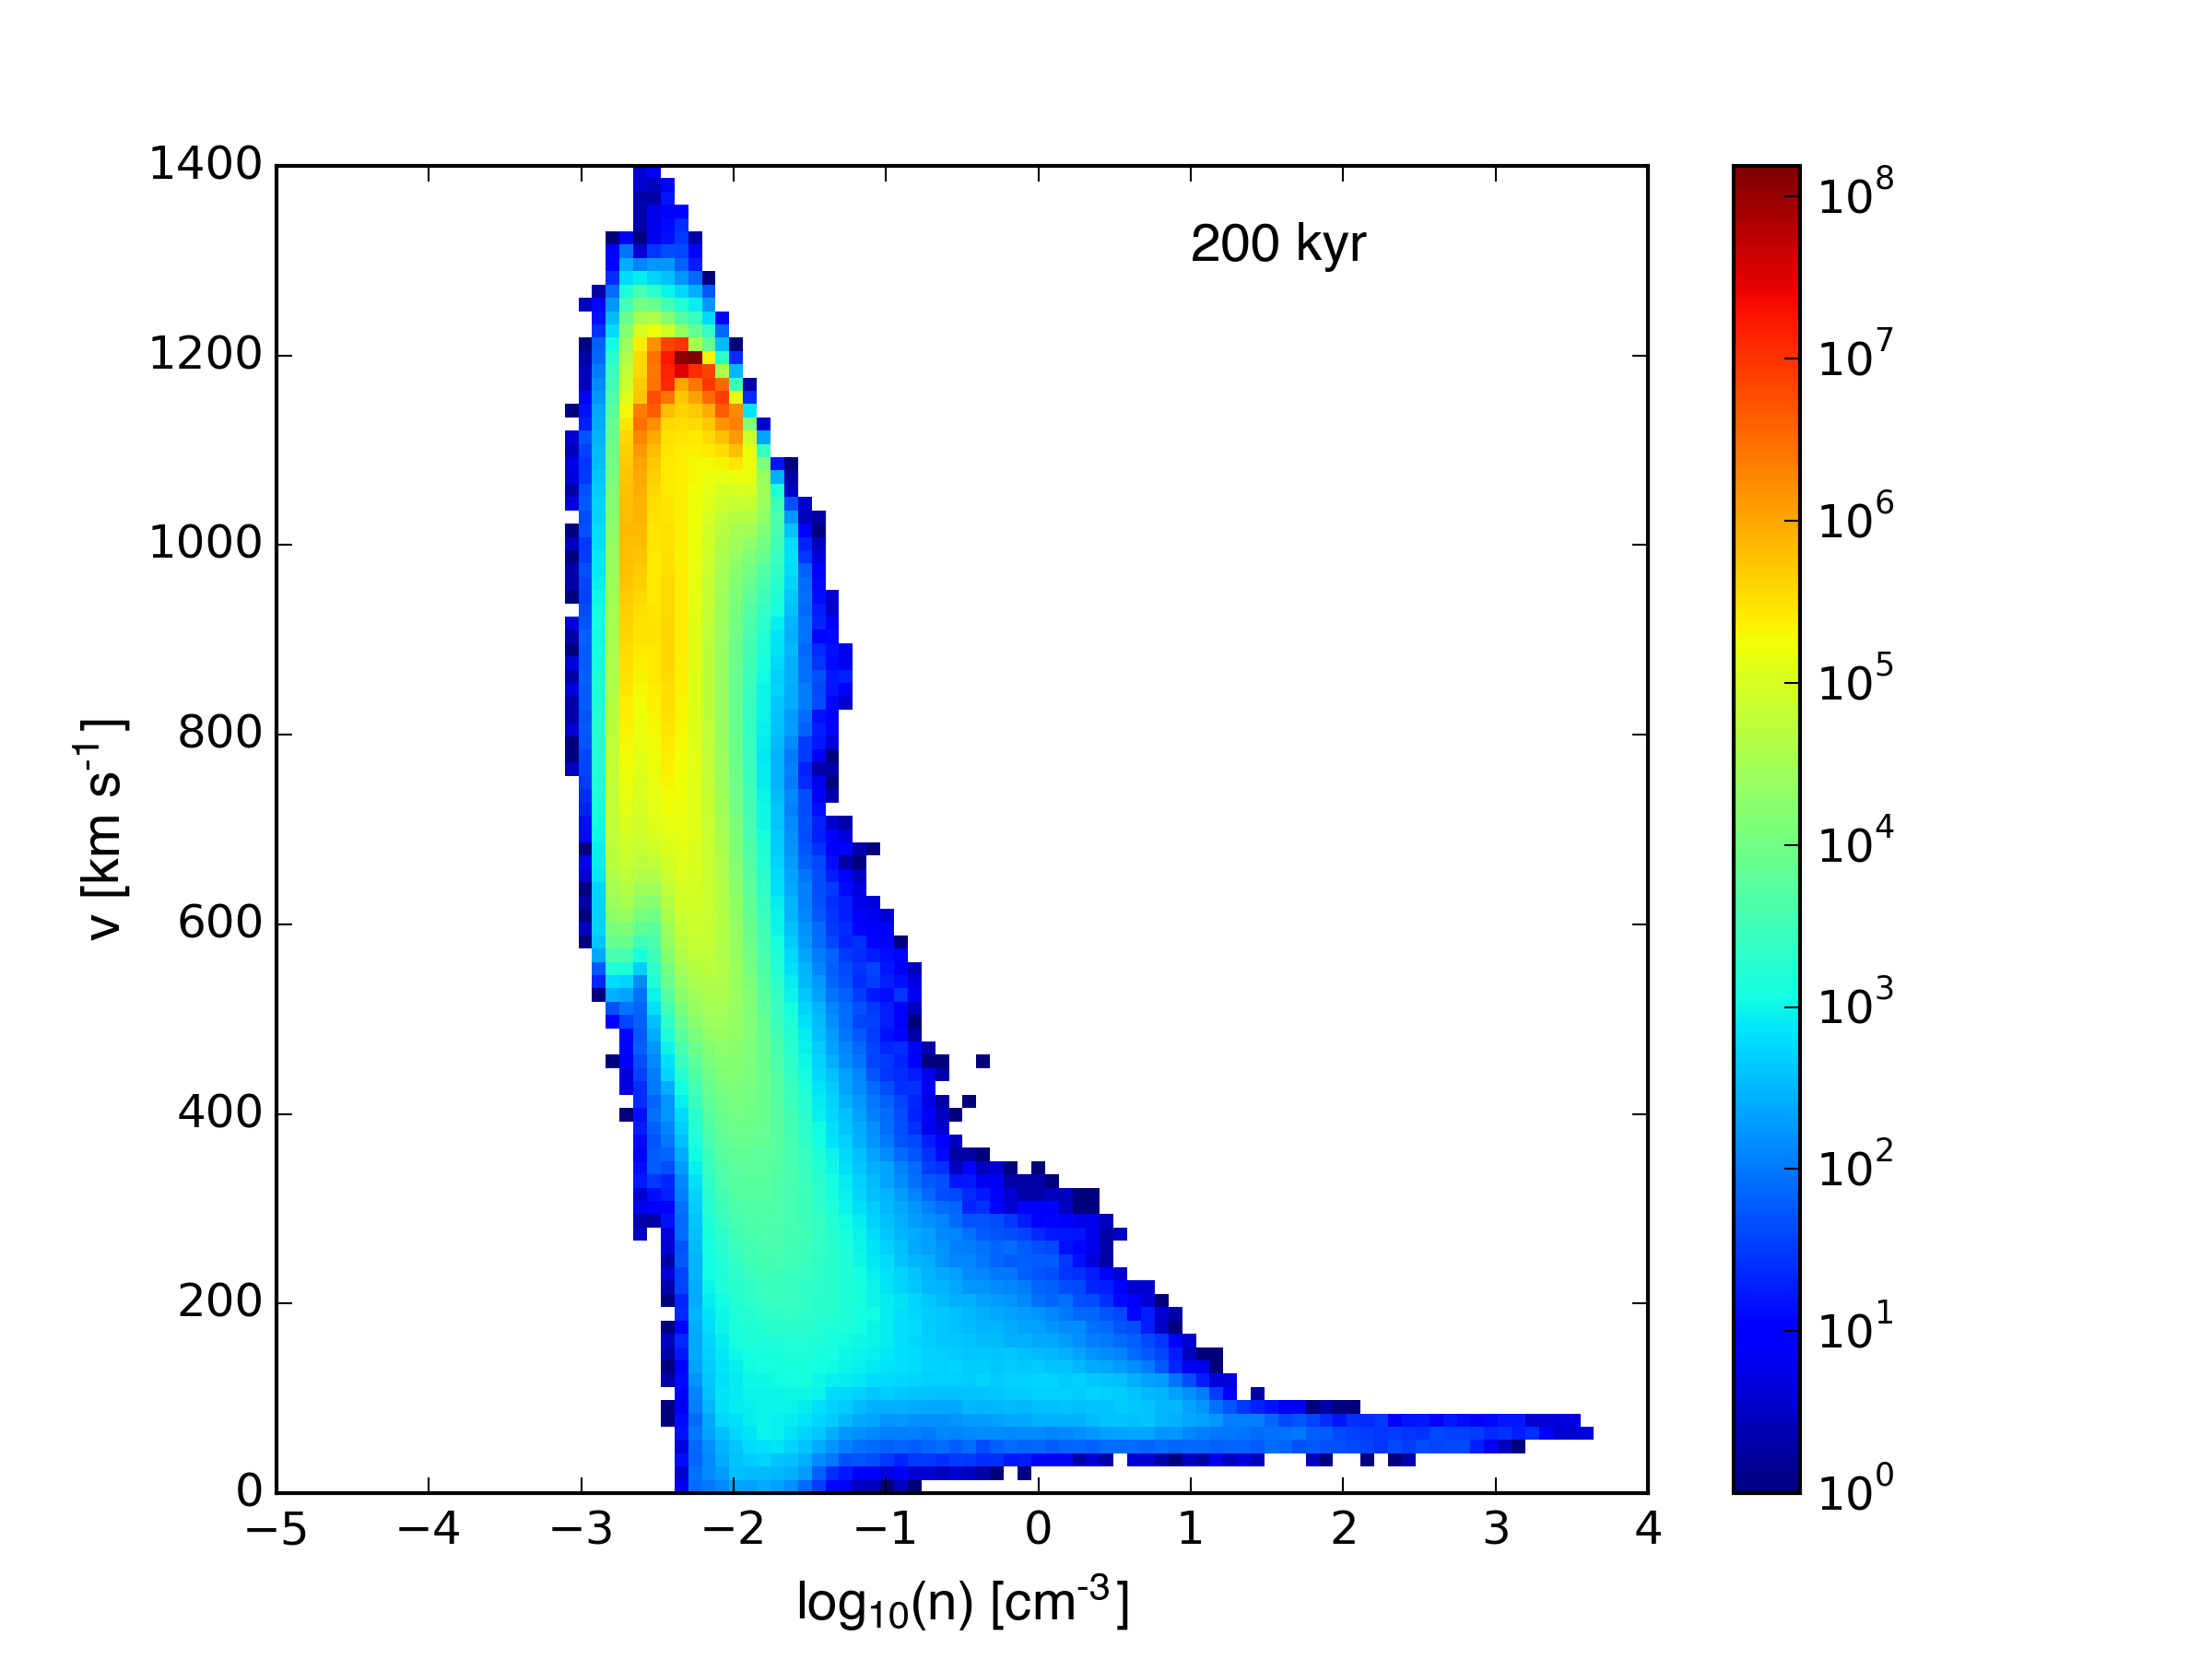
Density-velocity plots:
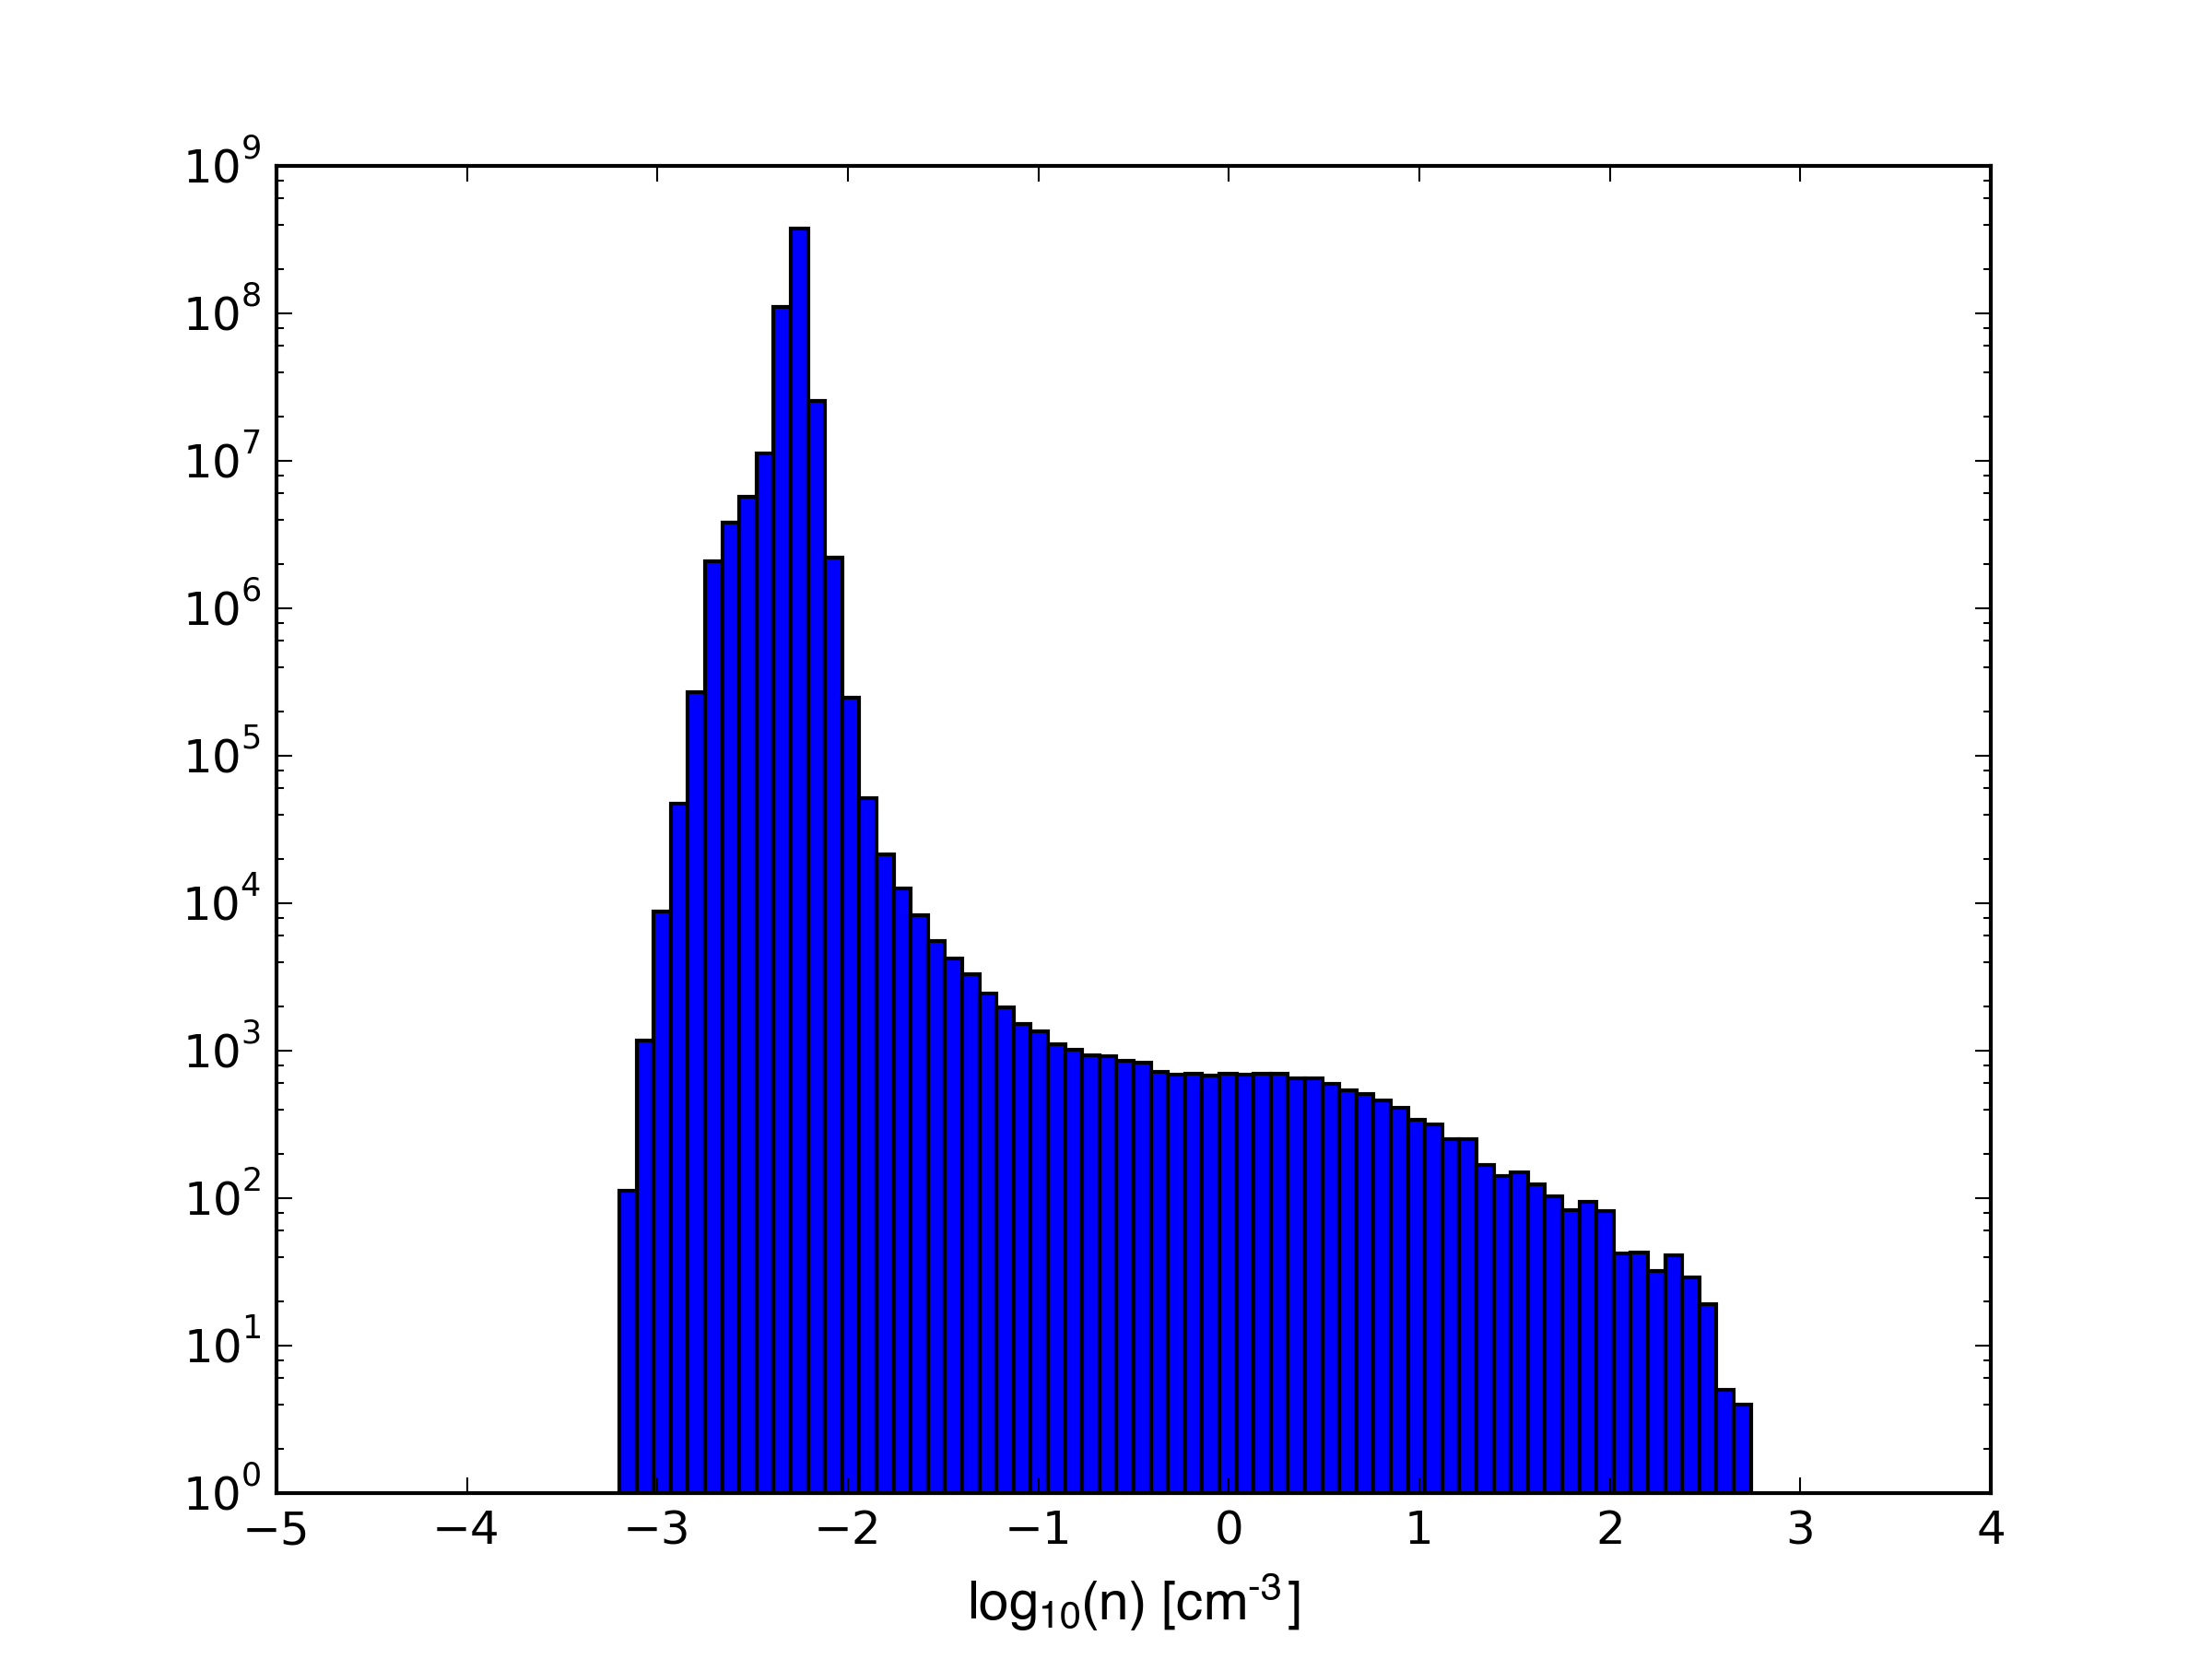
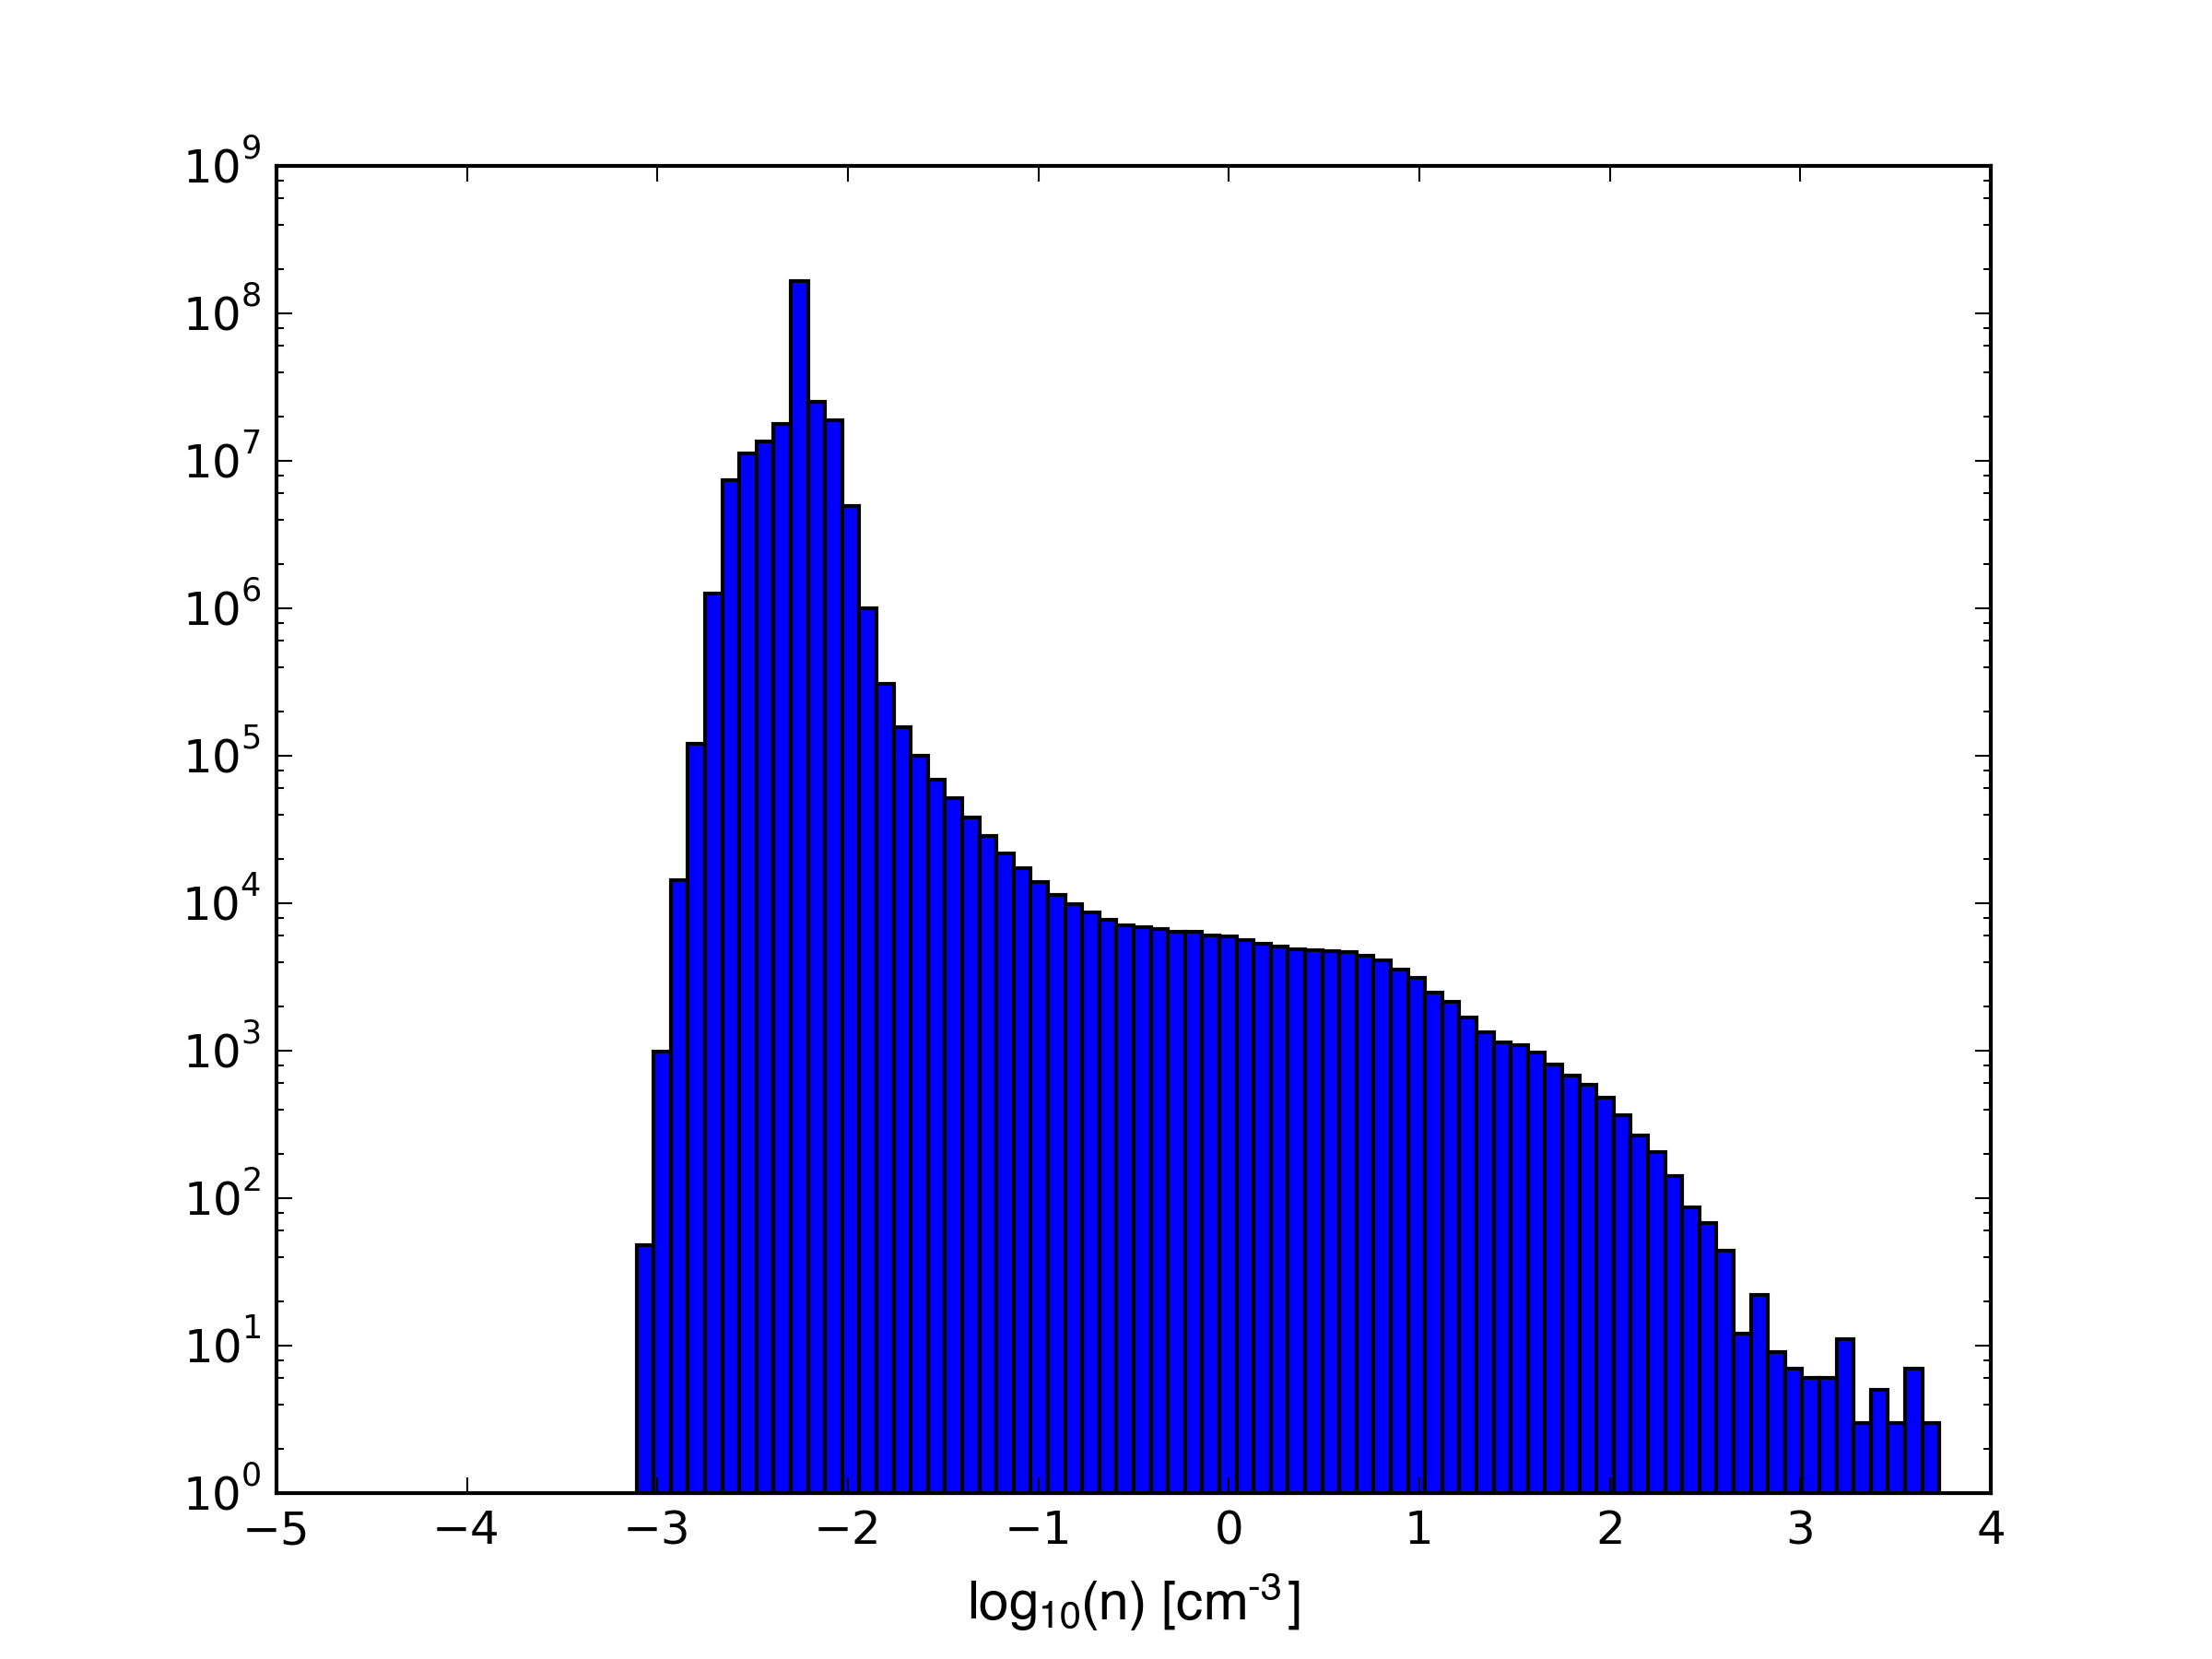
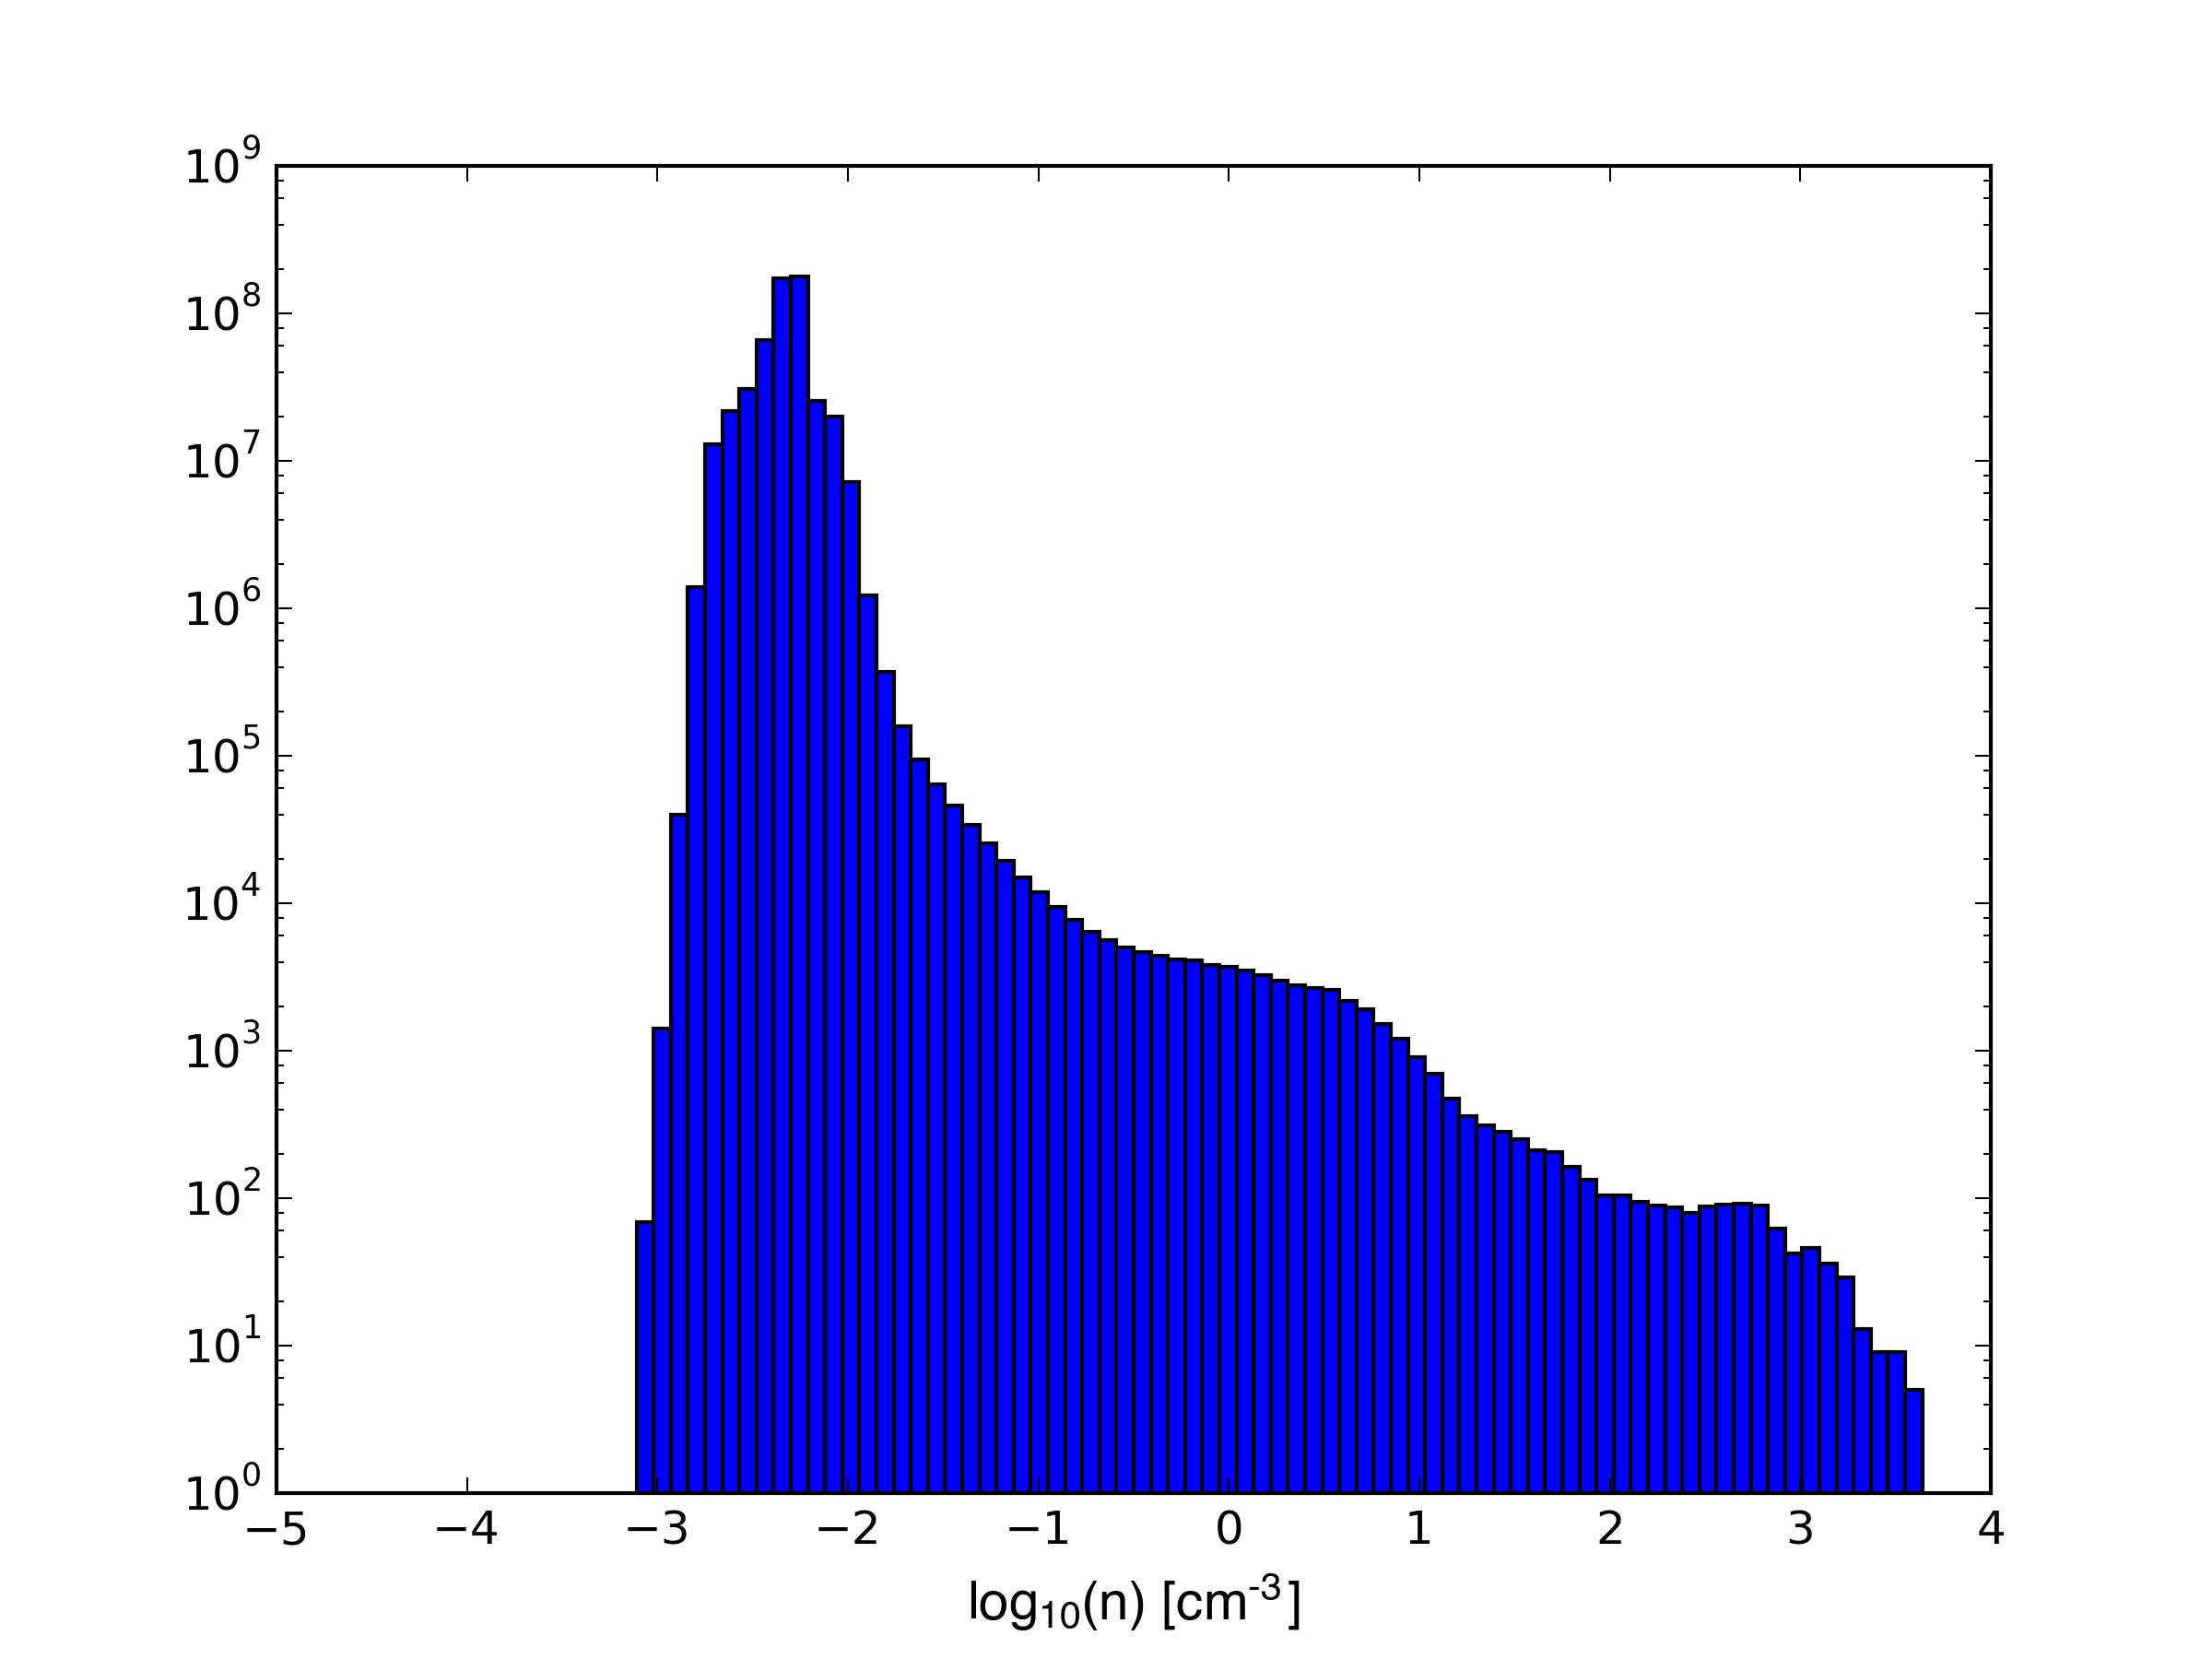
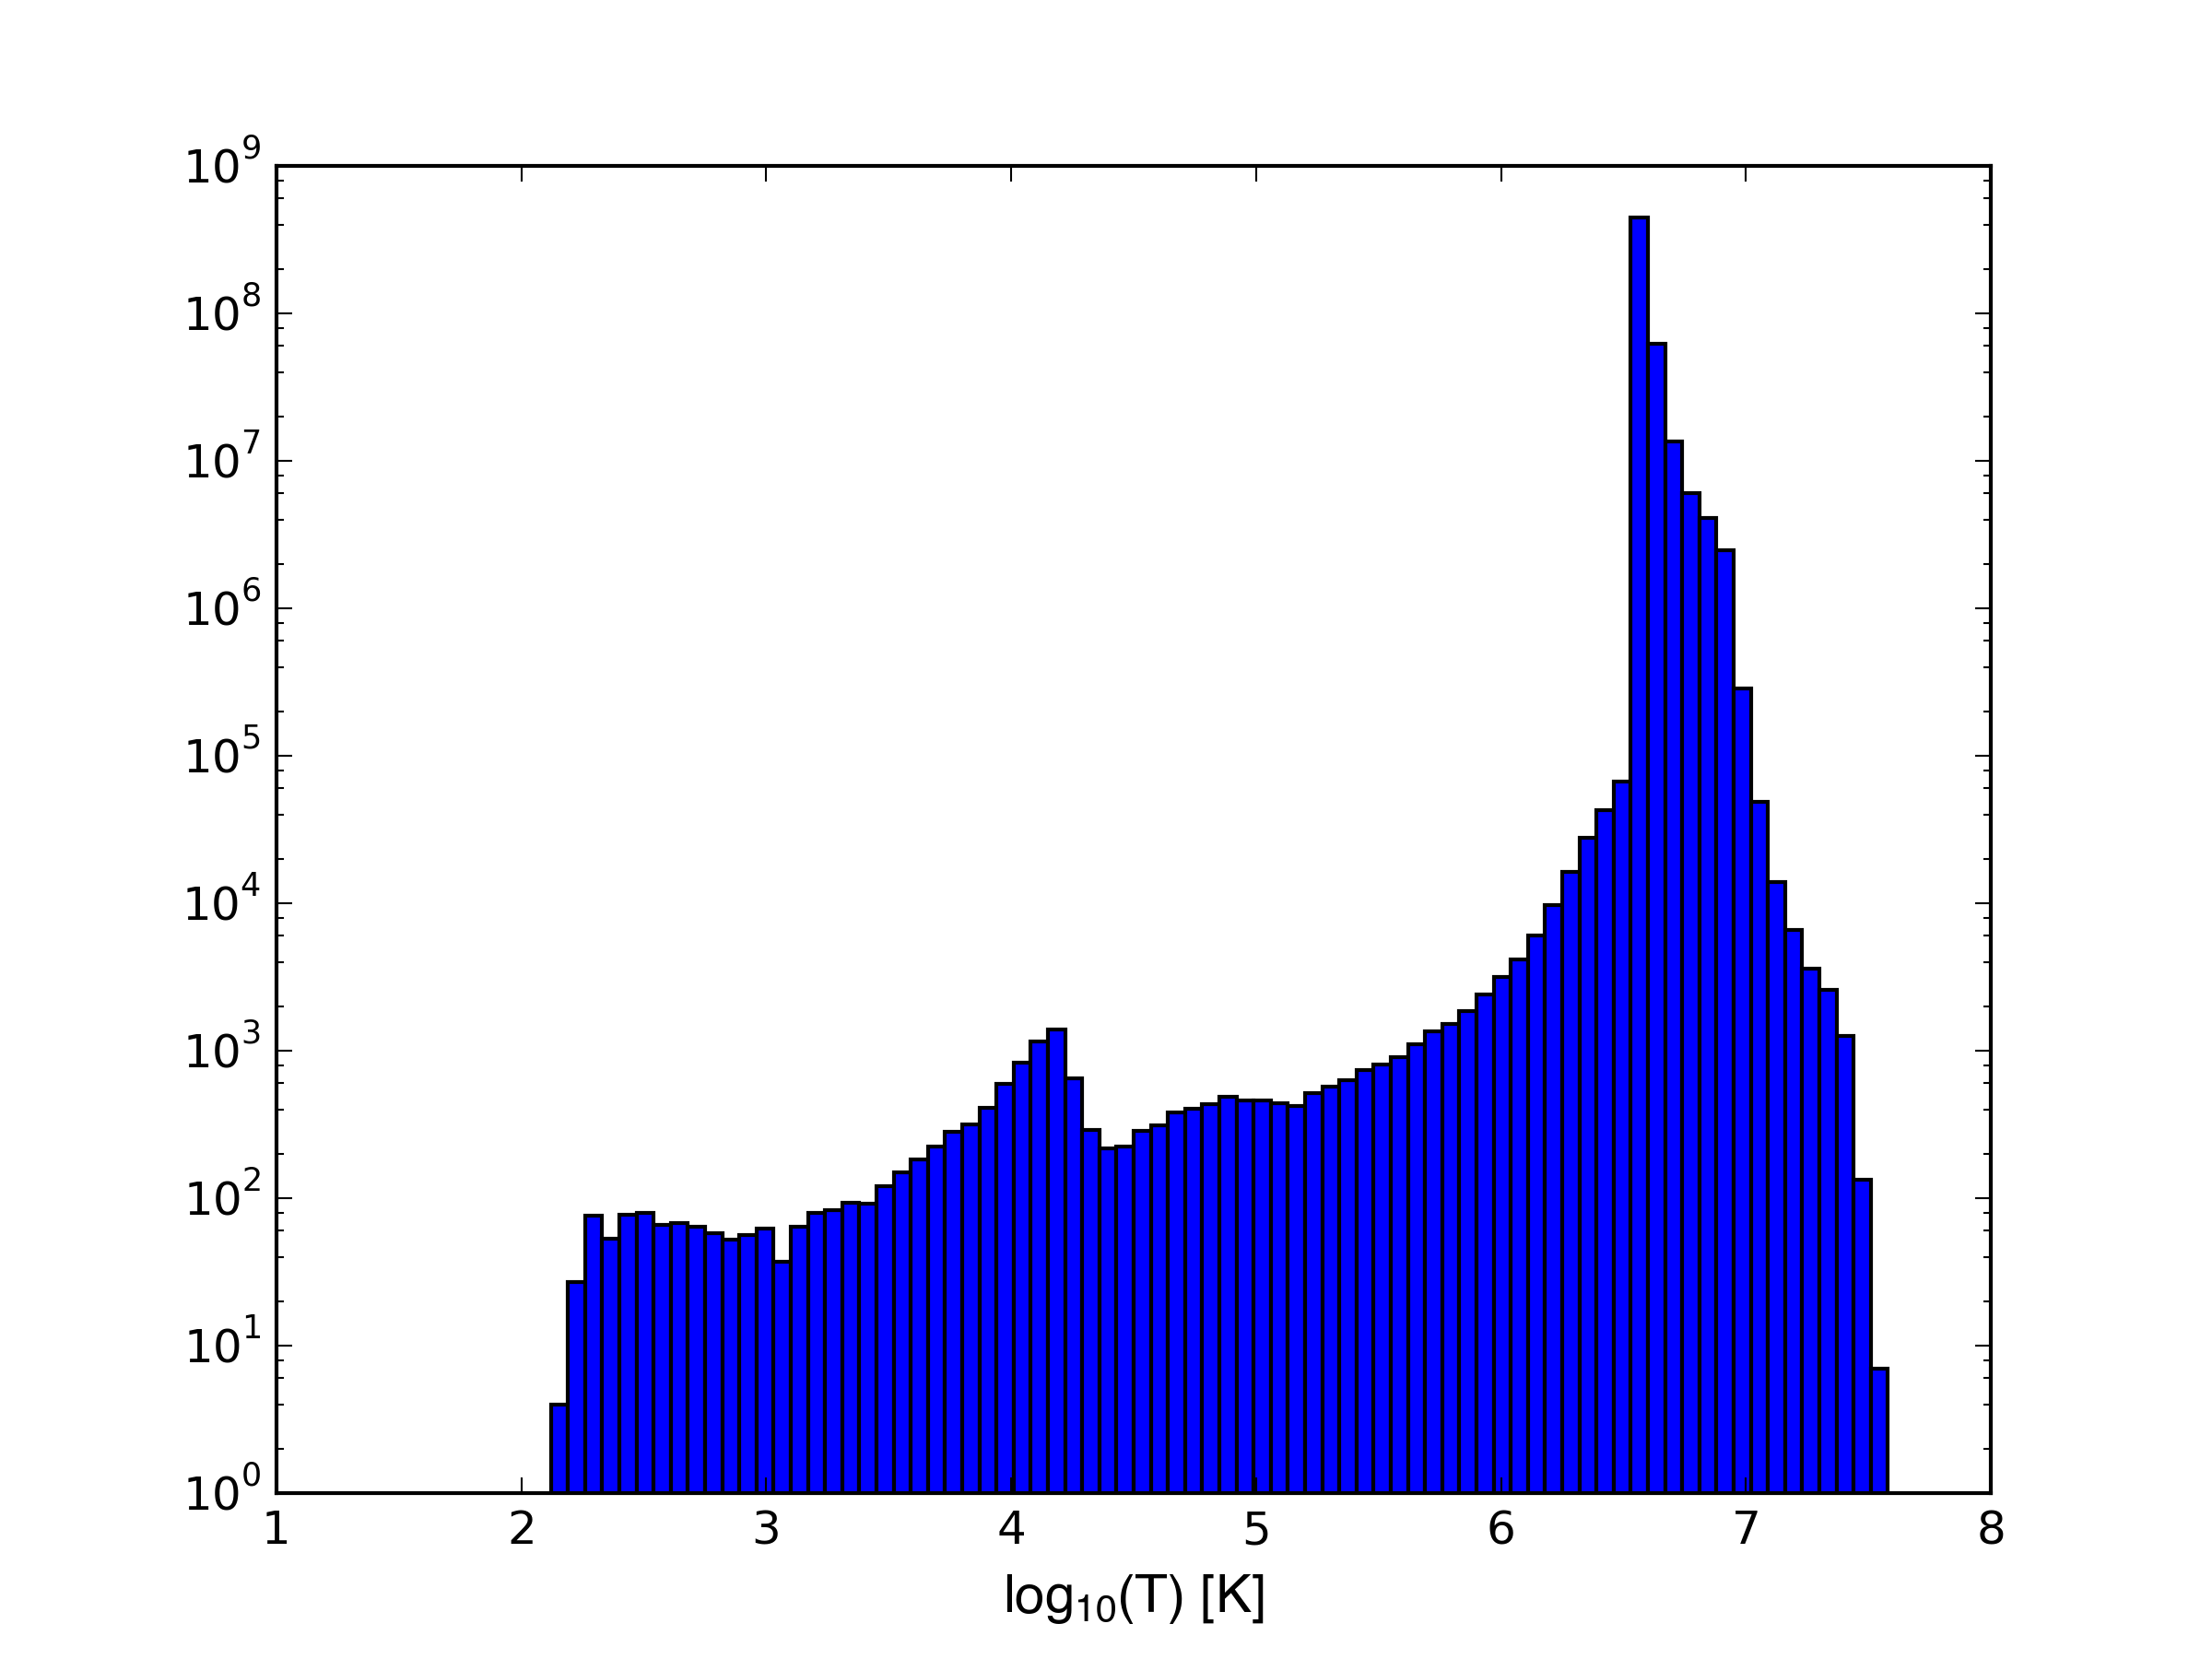
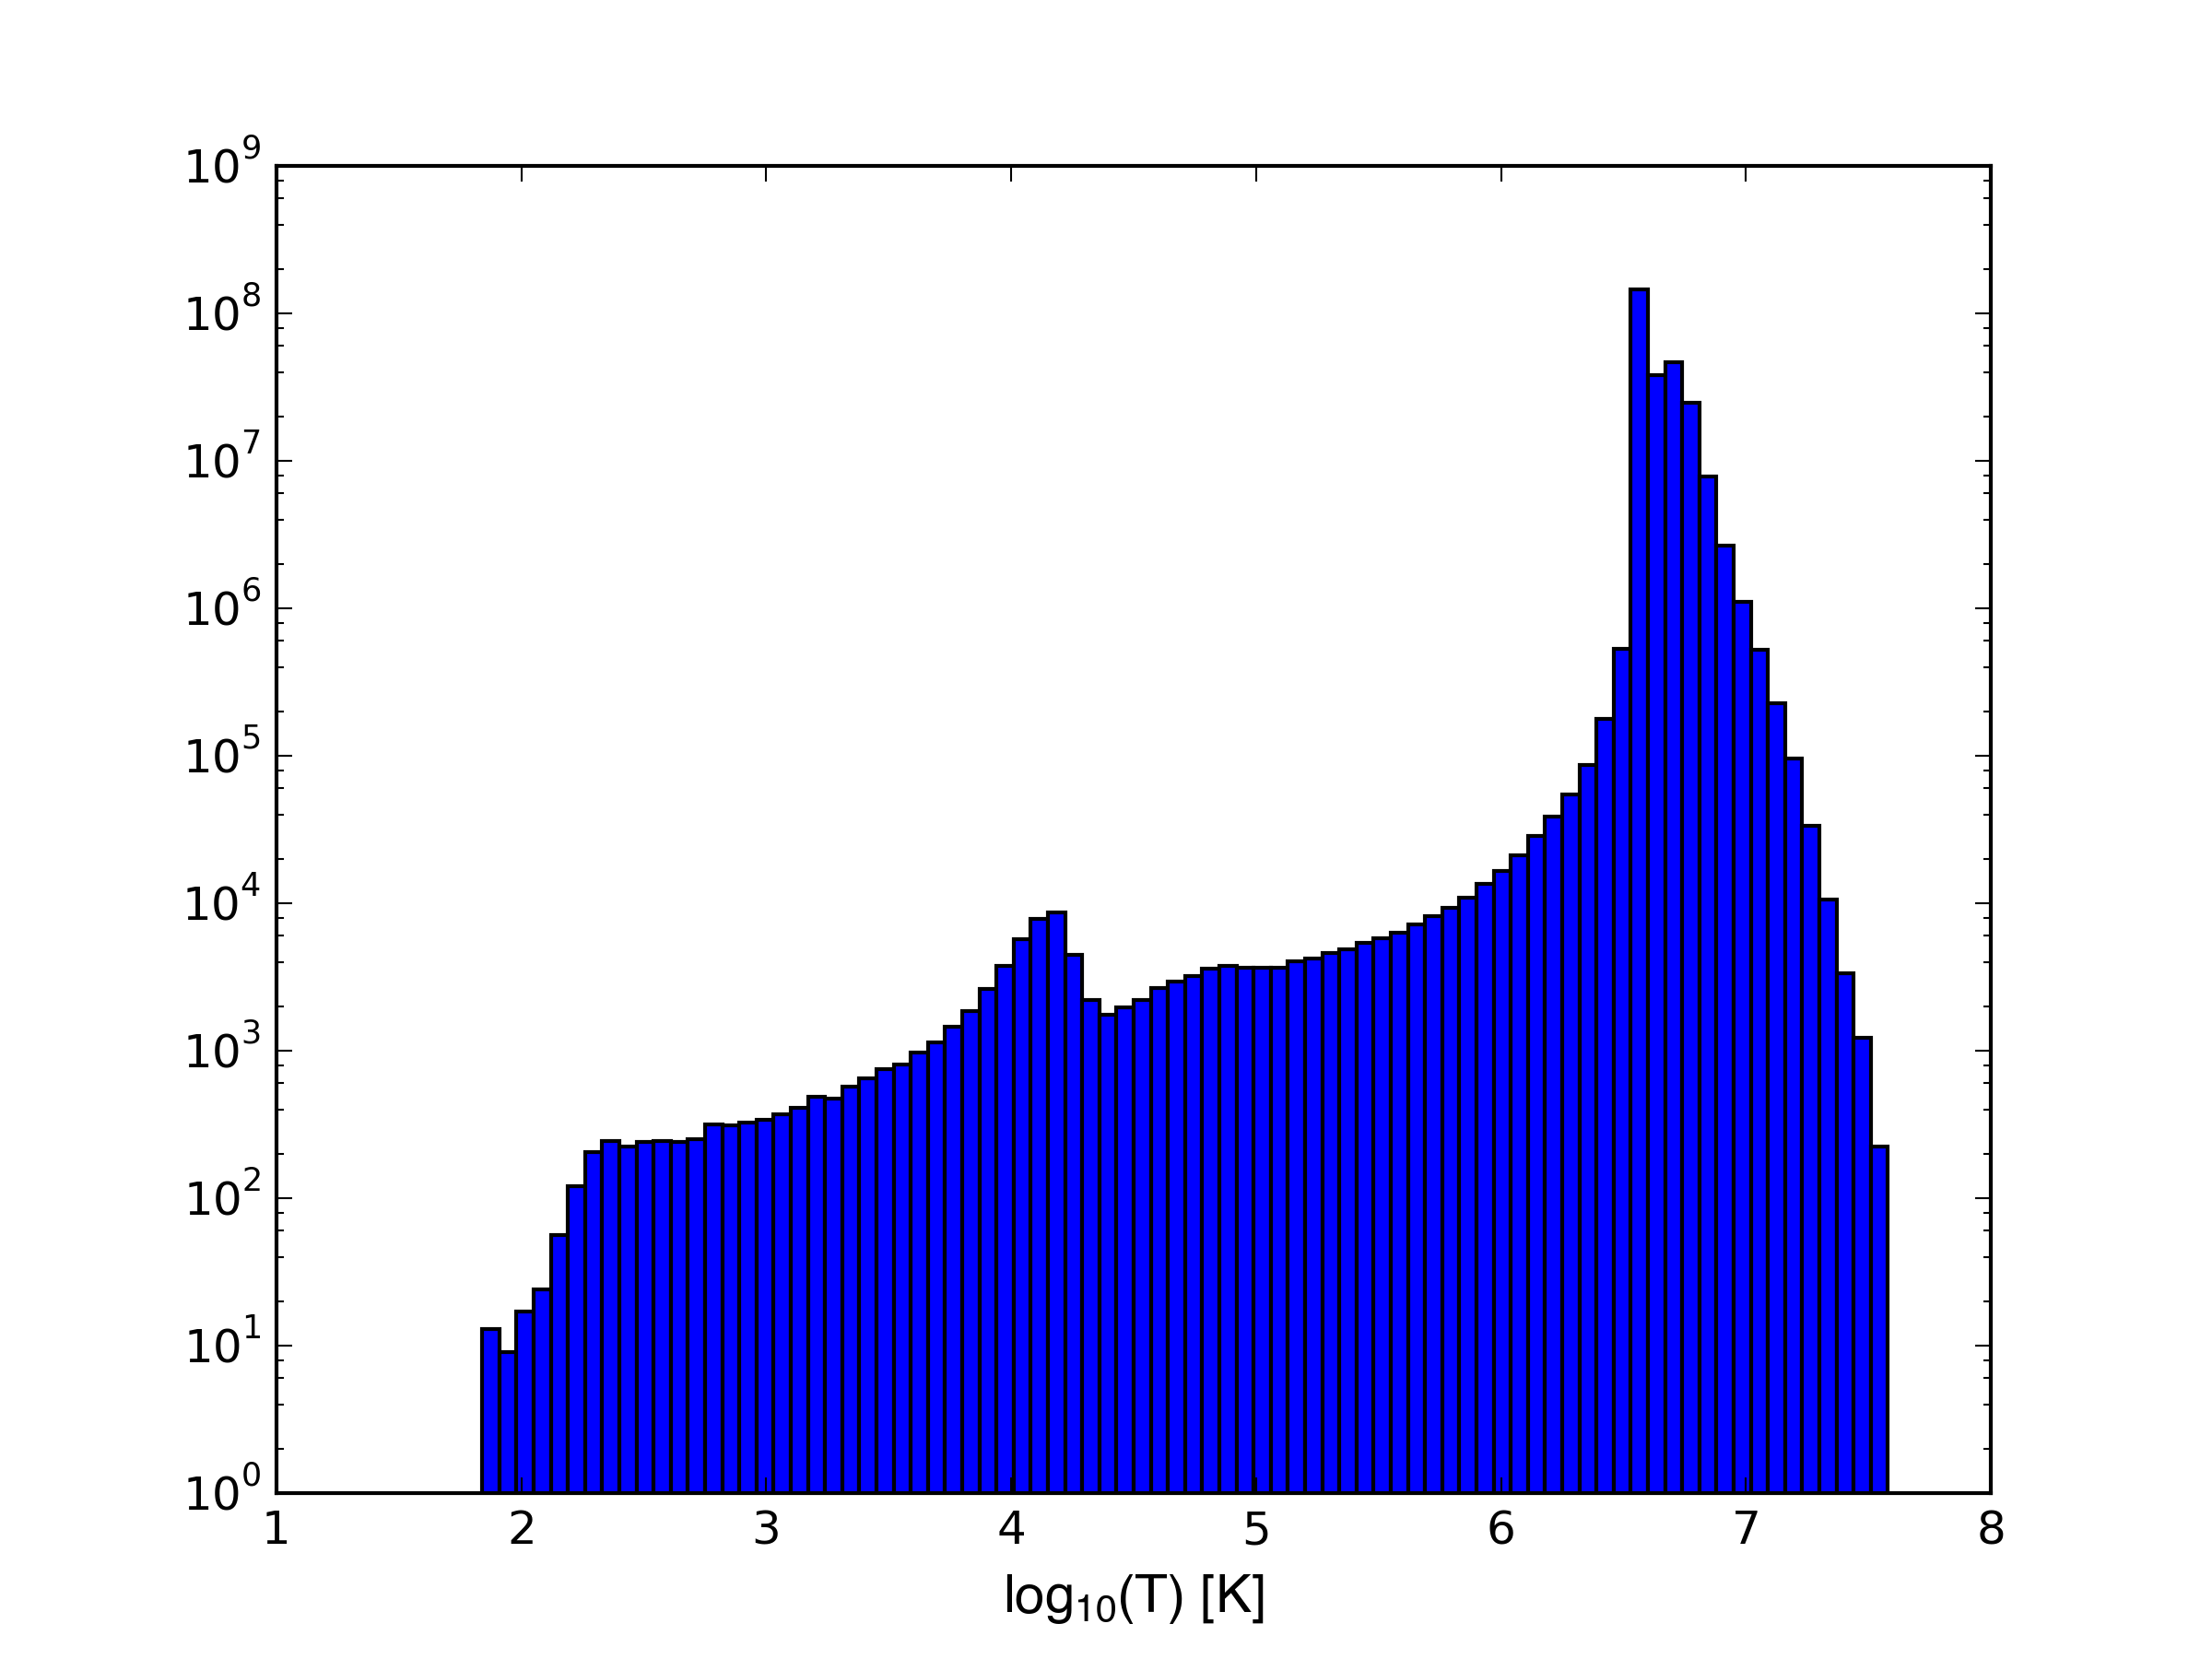
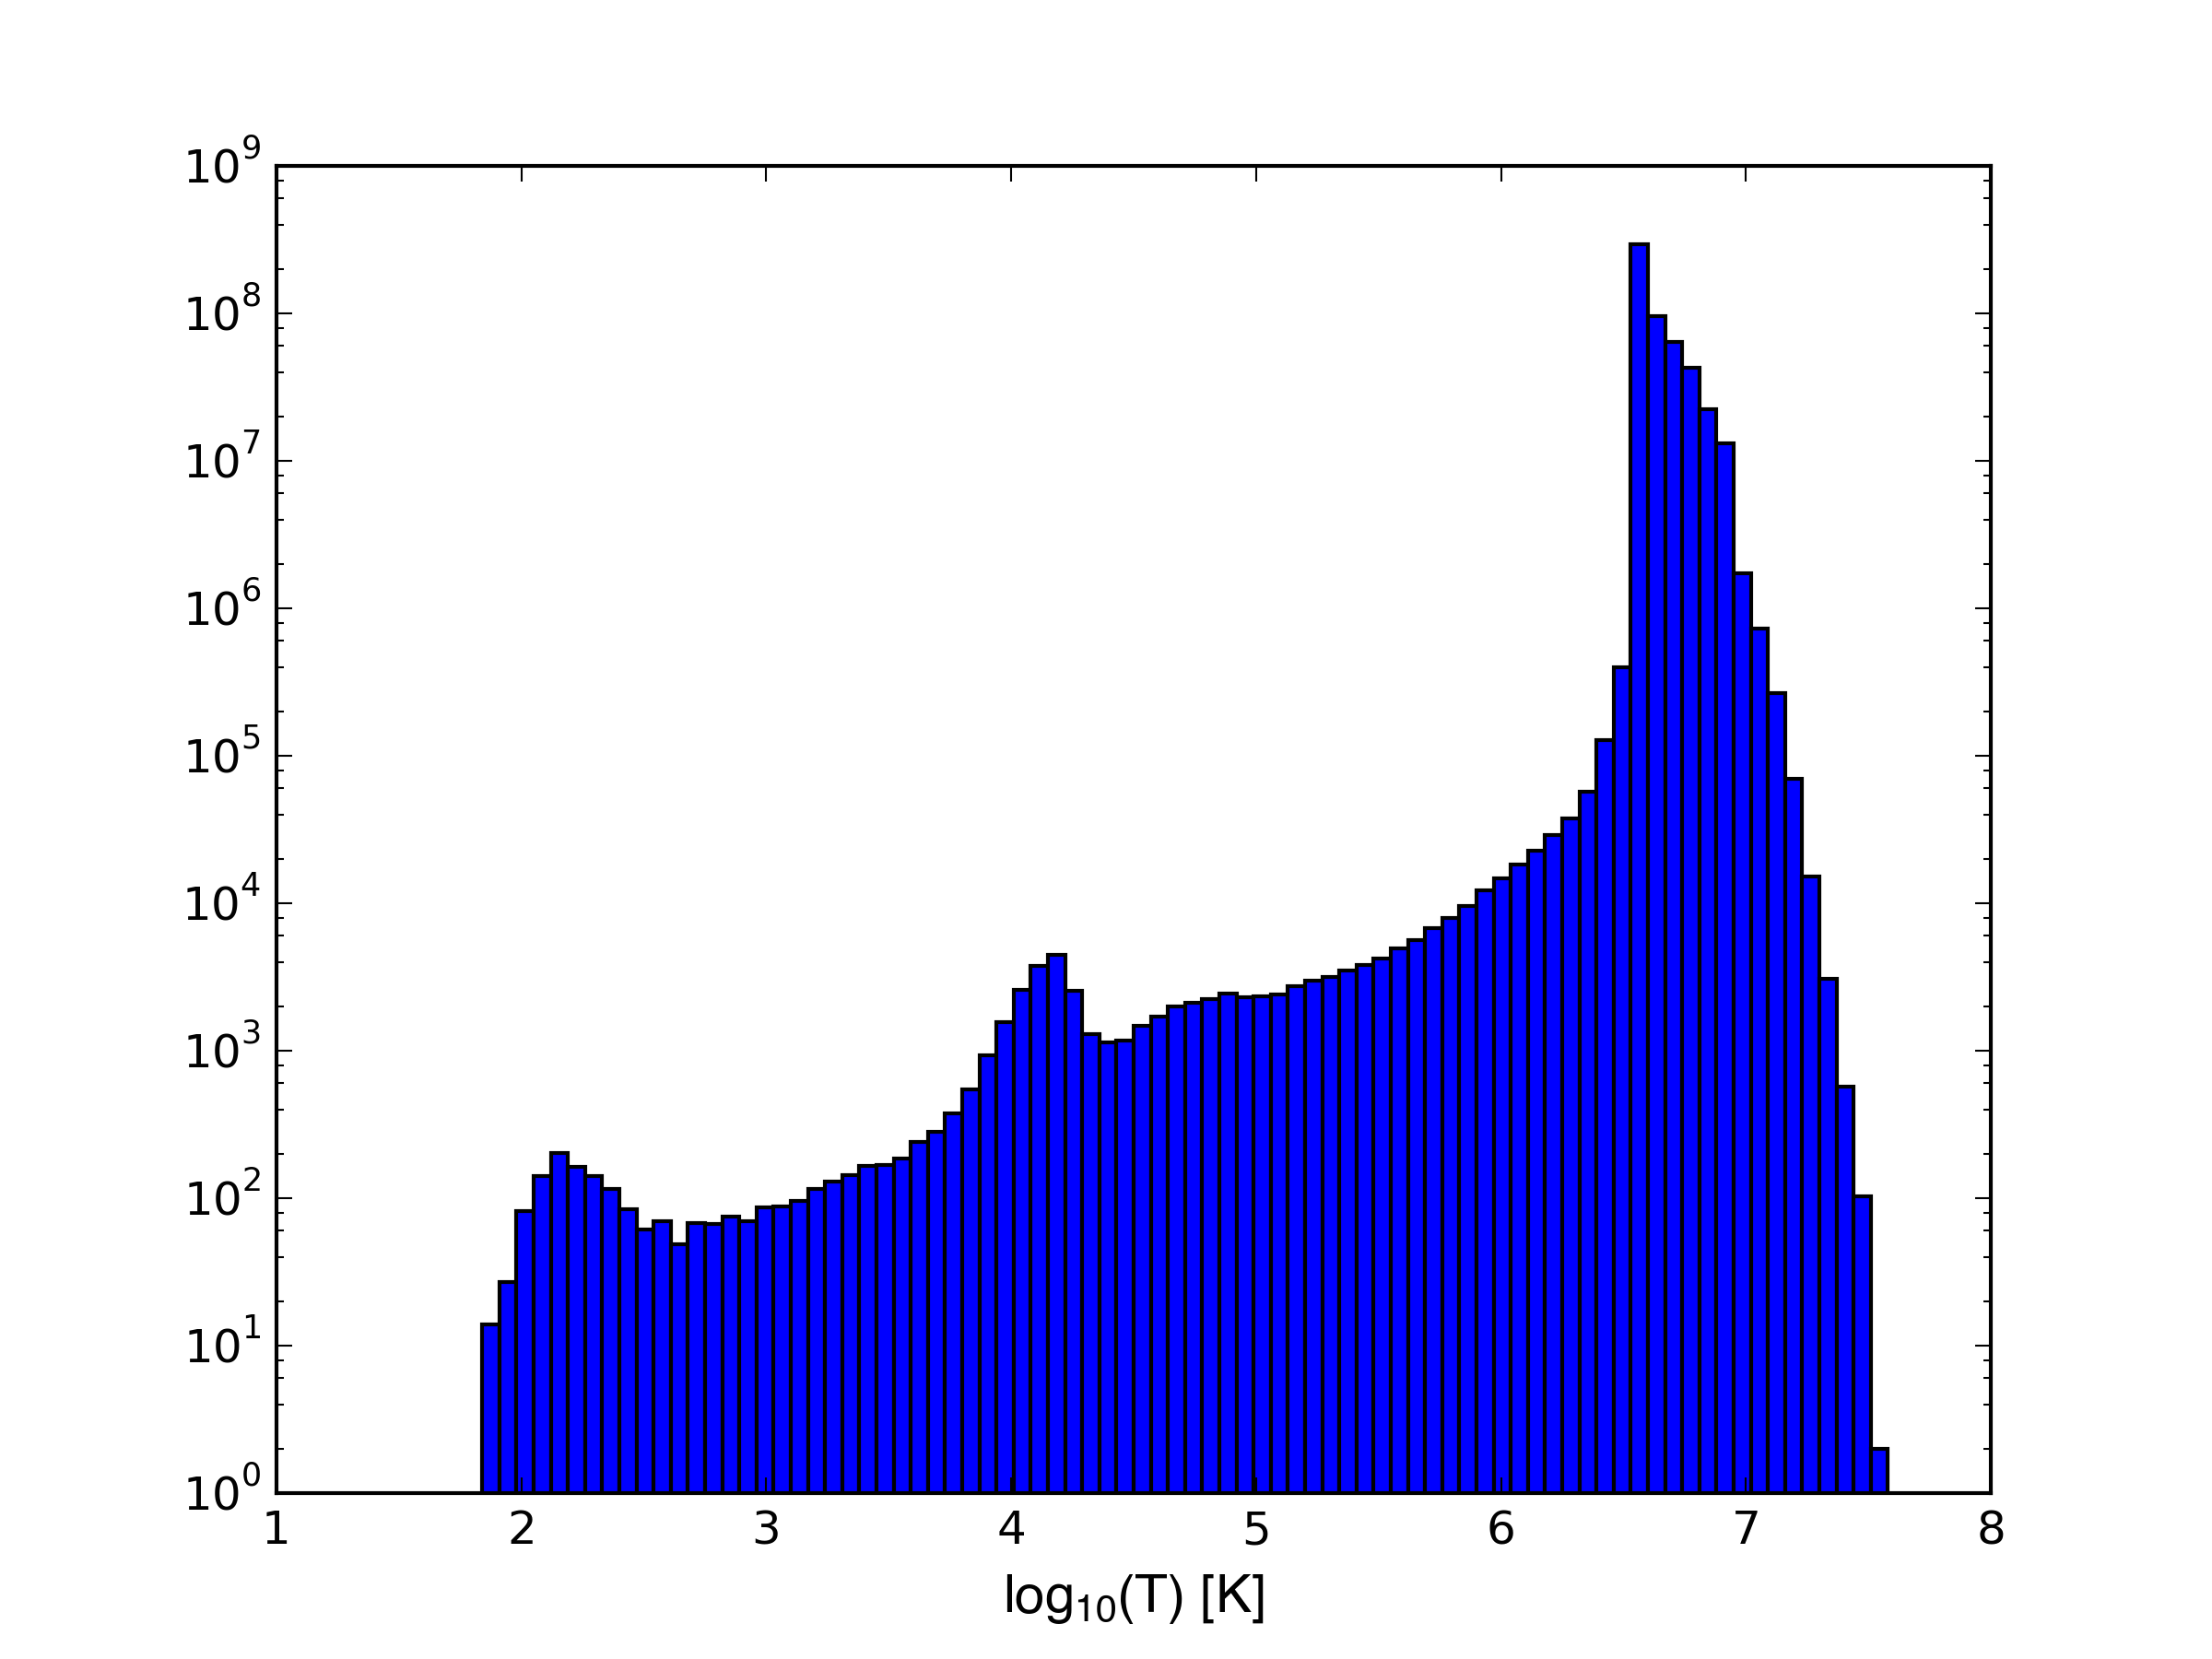
1D histograms of density and temperature: