Convergence
April 21, 2016
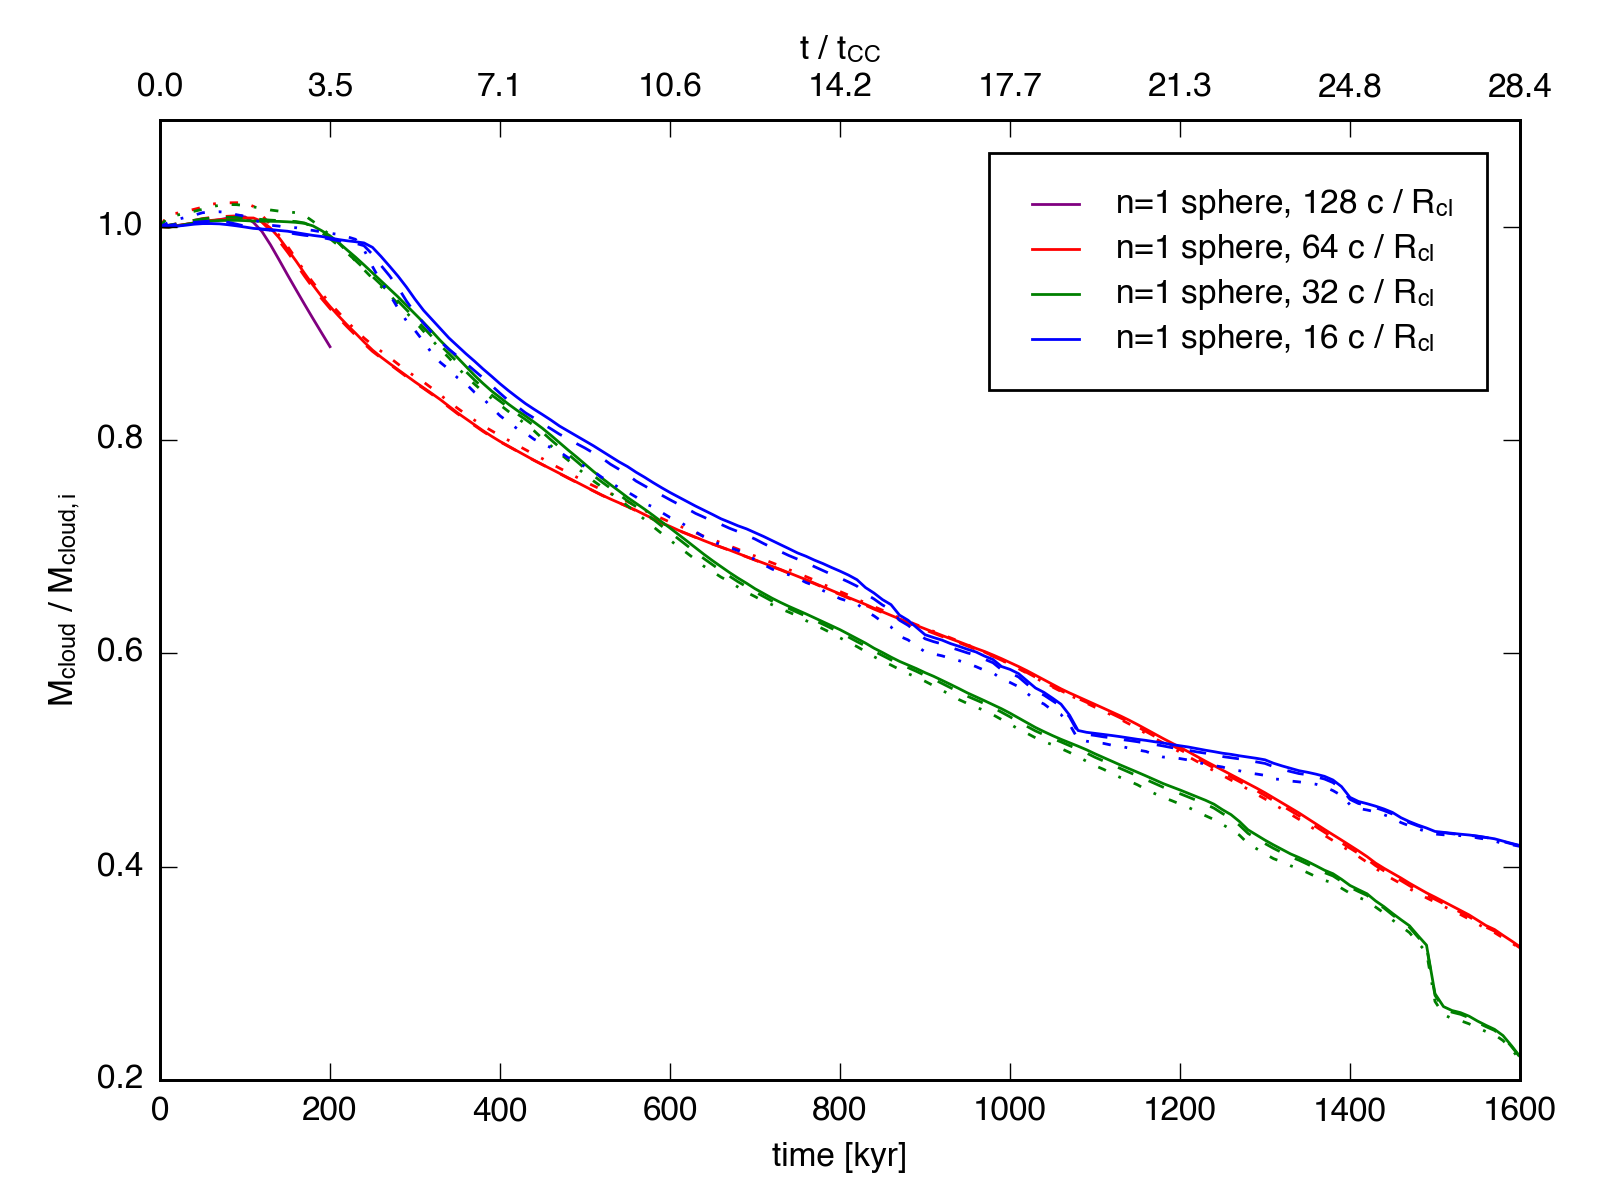
The plot below shows the evolution of the mass fraction for the \(n_h = 1\) sphere-wind simulation at four different resolutions. The lowest-resolution sim had 16 cells / \(R_\mathrm{cl}\), followed by 32 cells / \(R_\mathrm{cl}\), 64 cells / \(R_\mathrm{cl}\), and 128 cells / \(R_\mathrm{cl}\). All simulations were run on a grid with physical size \(160\times40\times40\) pc, except the highest, which was run in an \(80\times30\times30\) pc box, and only until \(t = 200\) kyr. Lines show the mass fraction calculated as the fraction of material above 1/20th the intitial median density (solid), 1/10th the initial median density (dashed), and 1/3rd the intial median density (dash-dot).
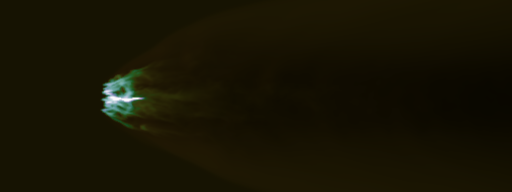
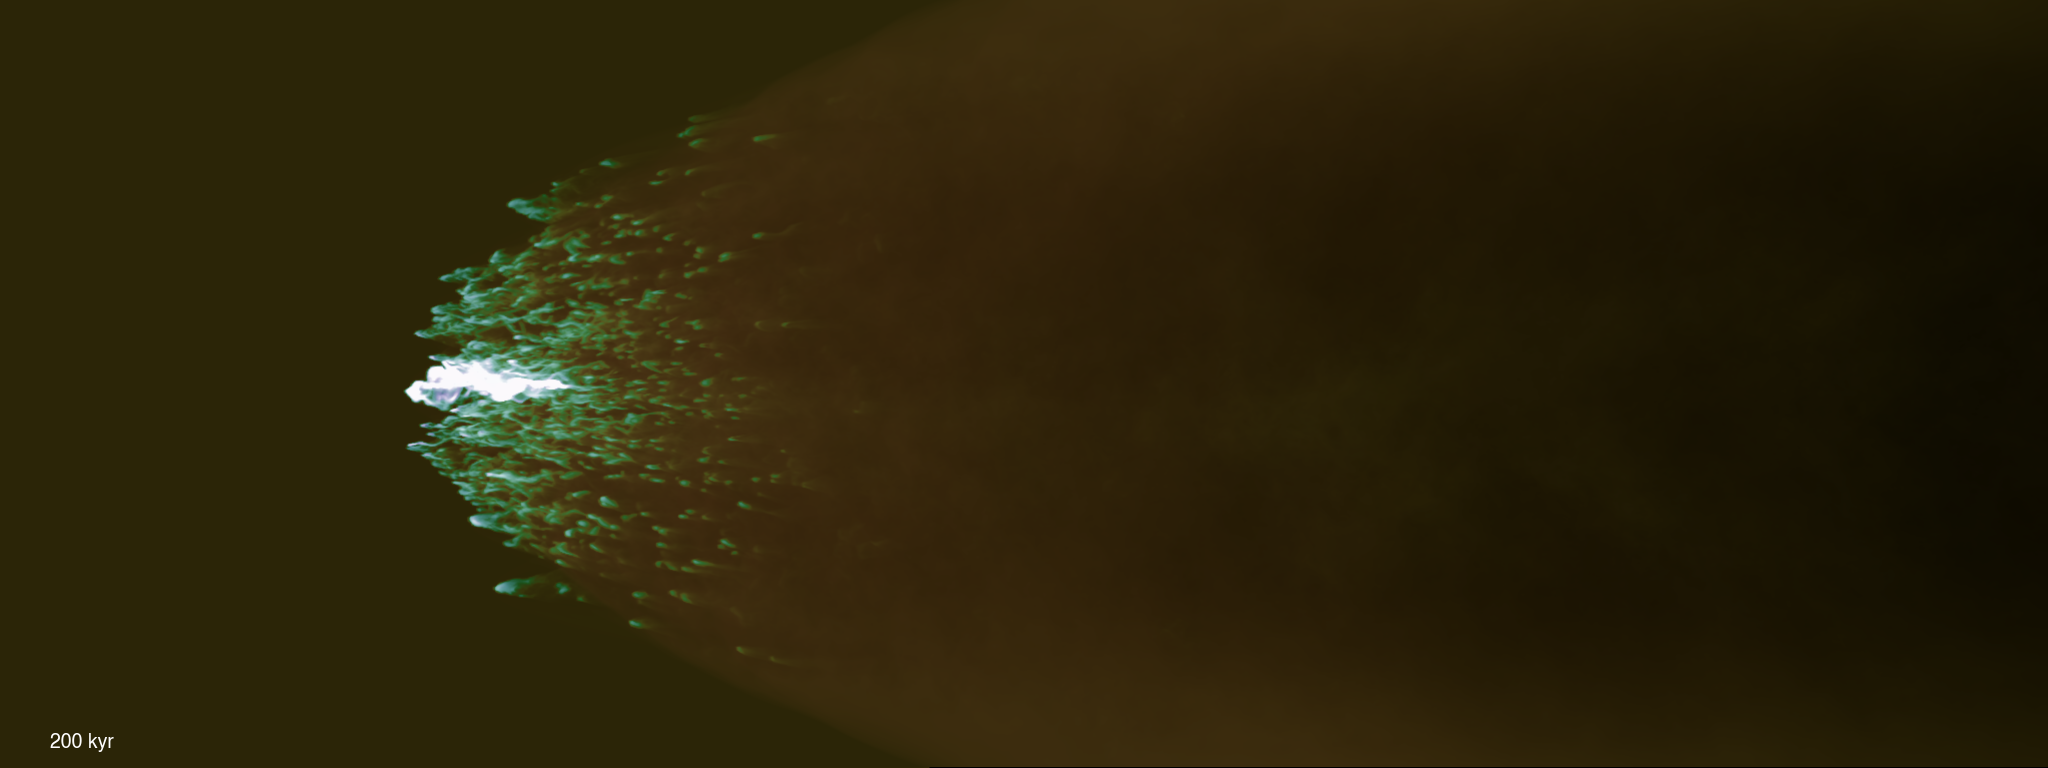
In addition, below are snapshots of the clouds at 200 kyr: